![]()
![]()

![]()


Outline
Background
The fundamental question
What we are going to do
Our current plan
Initial results
What NEXT?
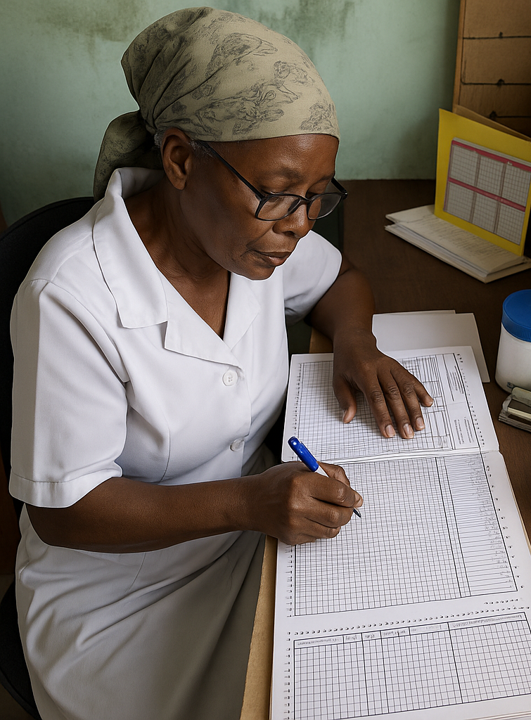
The Problem: A tale of two data streams
Health supply chains are struggling with forecasting at sub-national/ facility level.
Operational realities: Incomplete records, irregular orders, frequent manual adjustments.
This masks true demand and leads to a cycle of…
Persistent, critical stockouts 📉.
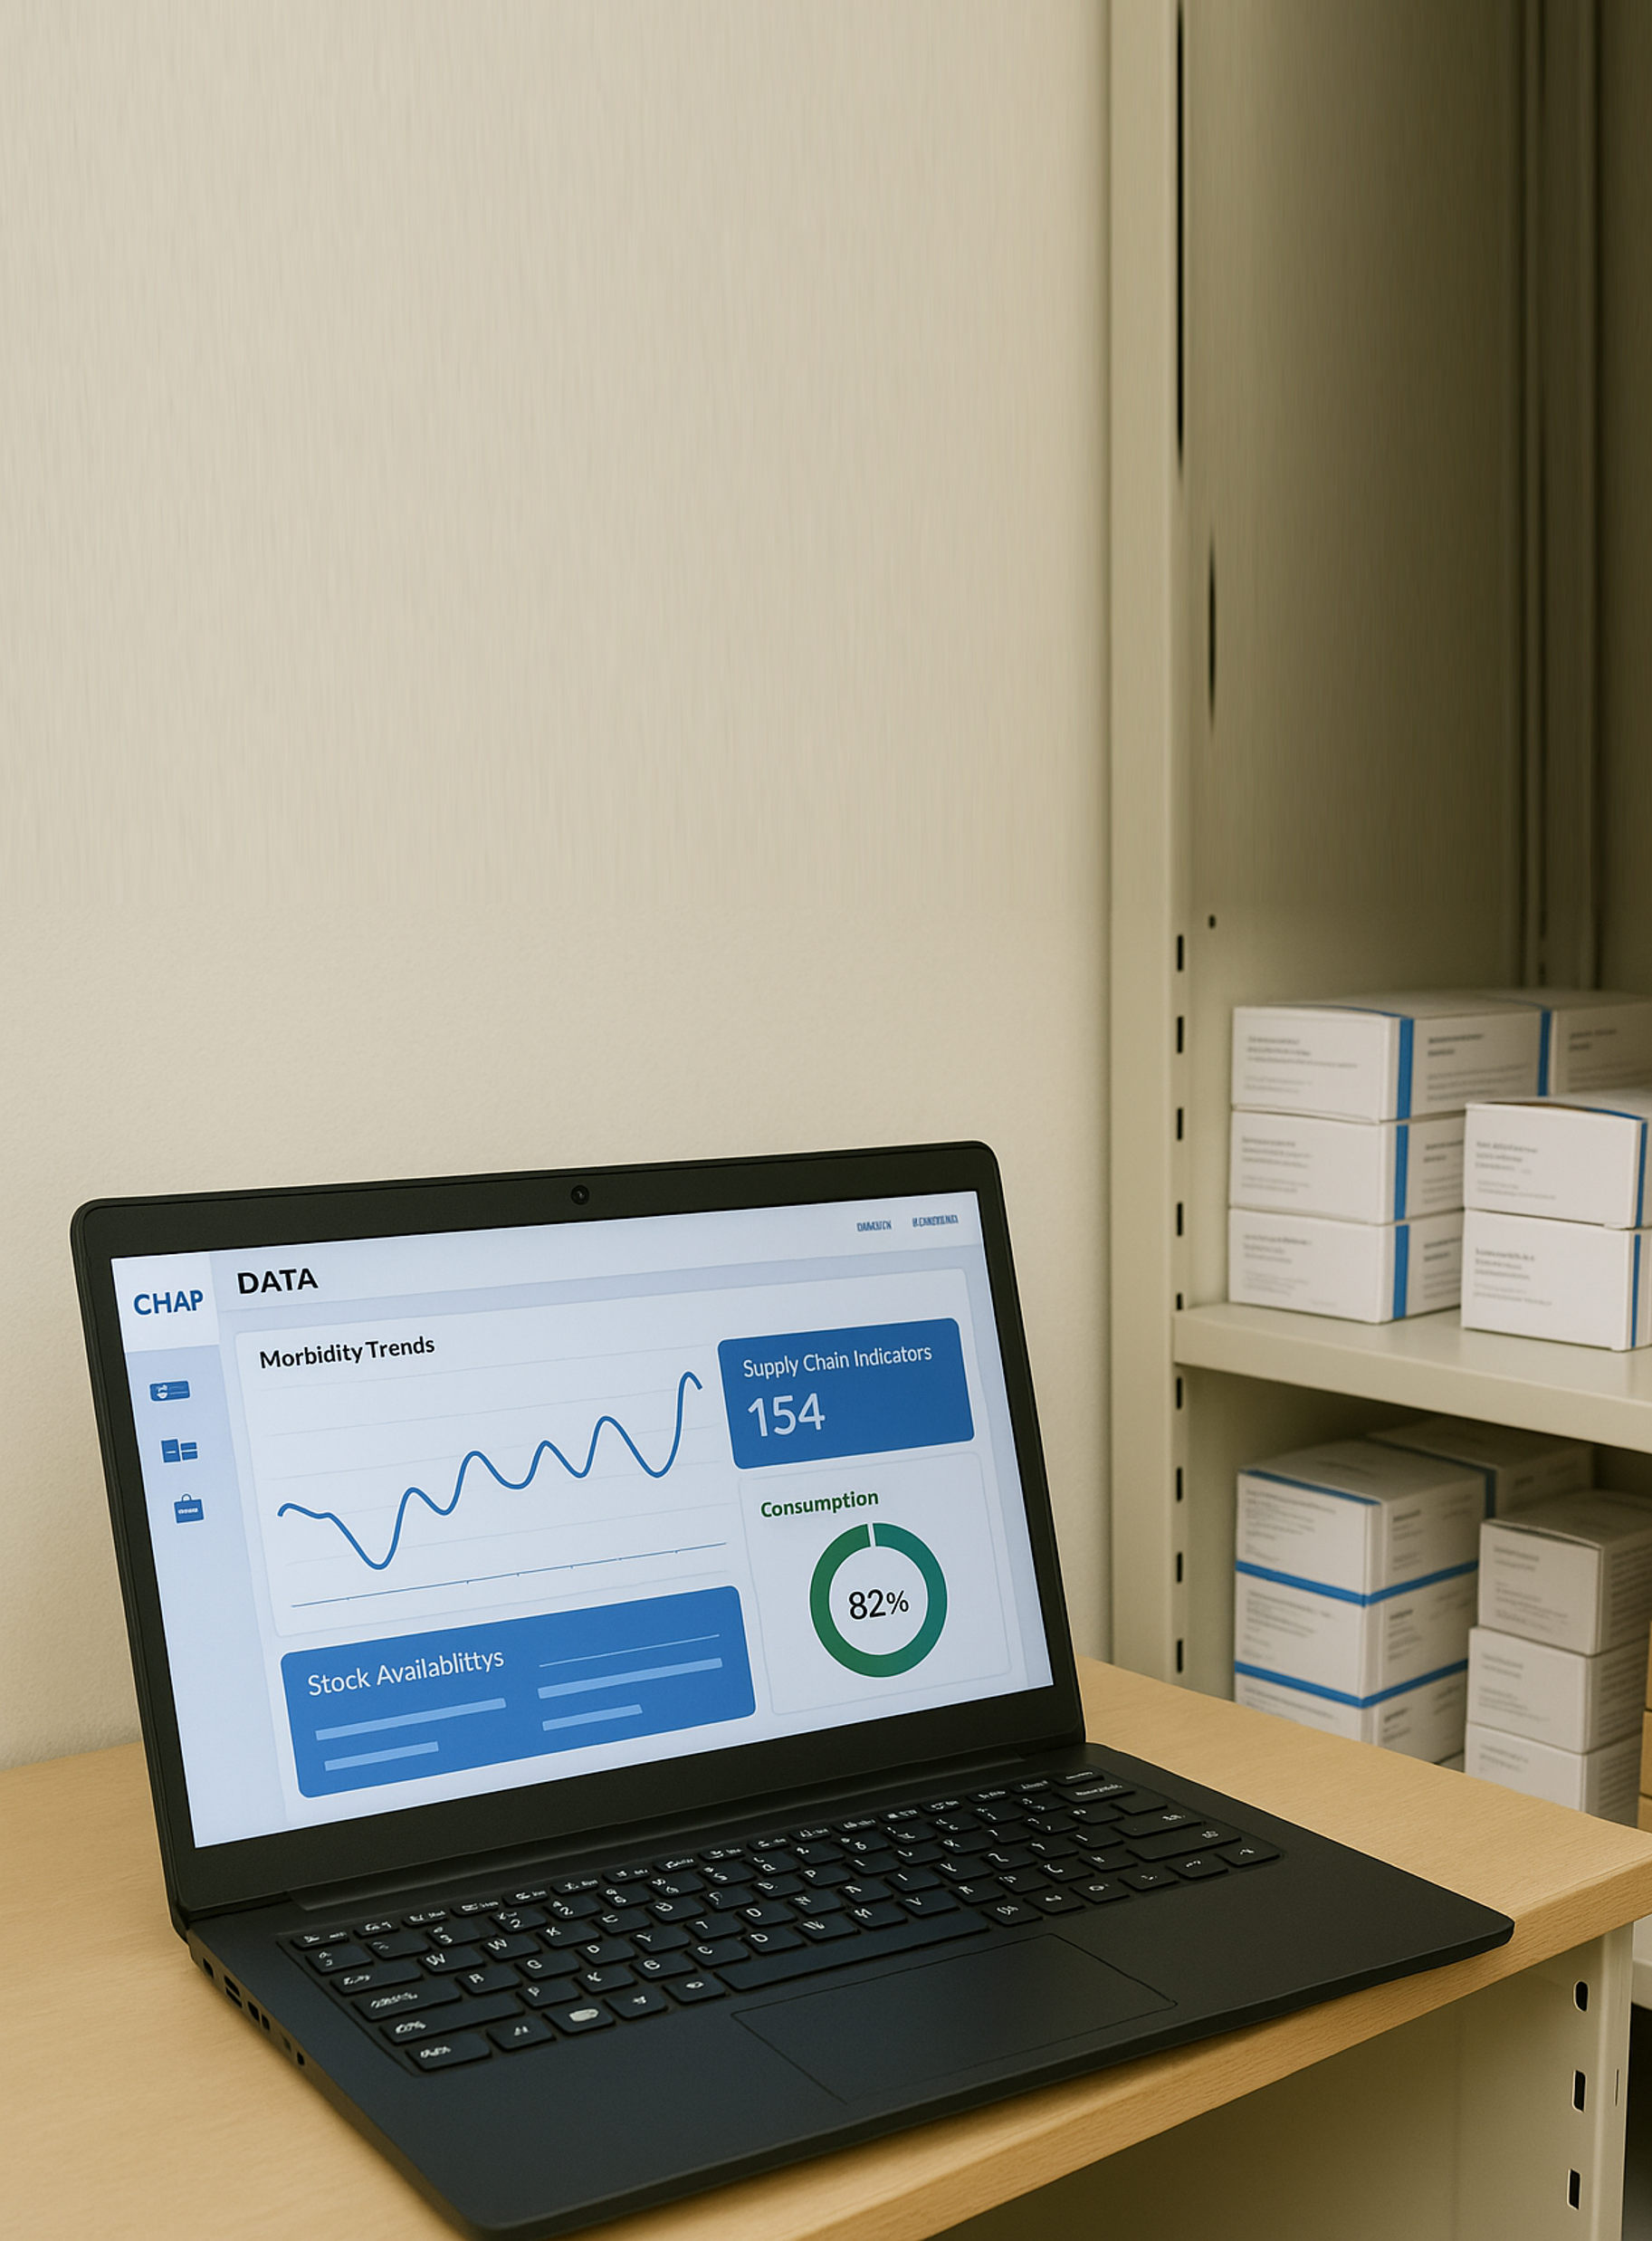
But… we have a success story.
Platforms like DHIS2 and CHAP have robust, high-performing models for forecasting disease cases (morbidity).
Our research questions
To solve this, we are investigating three key questions:
Portability: When can we transfer a model? (Morbidity \(\rightarrow\) Consumption? One product \(\rightarrow\) Another?)
Decision Translation: How do we turn a statistical forecast into a better inventory order? (Forecast \(\rightarrow\) Action)
Hierarchical Coherence: Do site-level forecasts reliably add up for district and national planning?
What we are going to do

We’ve organized our work into three interconnected Work Packages (WPs).
WP1: Portability (Test reuse/transfer. Create “if/then” rules.)
\(\downarrow\)
WP2: Forecast \(\rightarrow\) Inventory (Translate forecasts into real-world inventory policy.)
\(\downarrow\)
WP3: Hierarchical Coherence (Test aggregation for national procurement.)
Our current plan
Our immediate focus is on WP1 (Portability) and linking to WP2 (Inventory Simulation).

Data exploration
We used number of dengue cases in Laos to test the forecasting models.
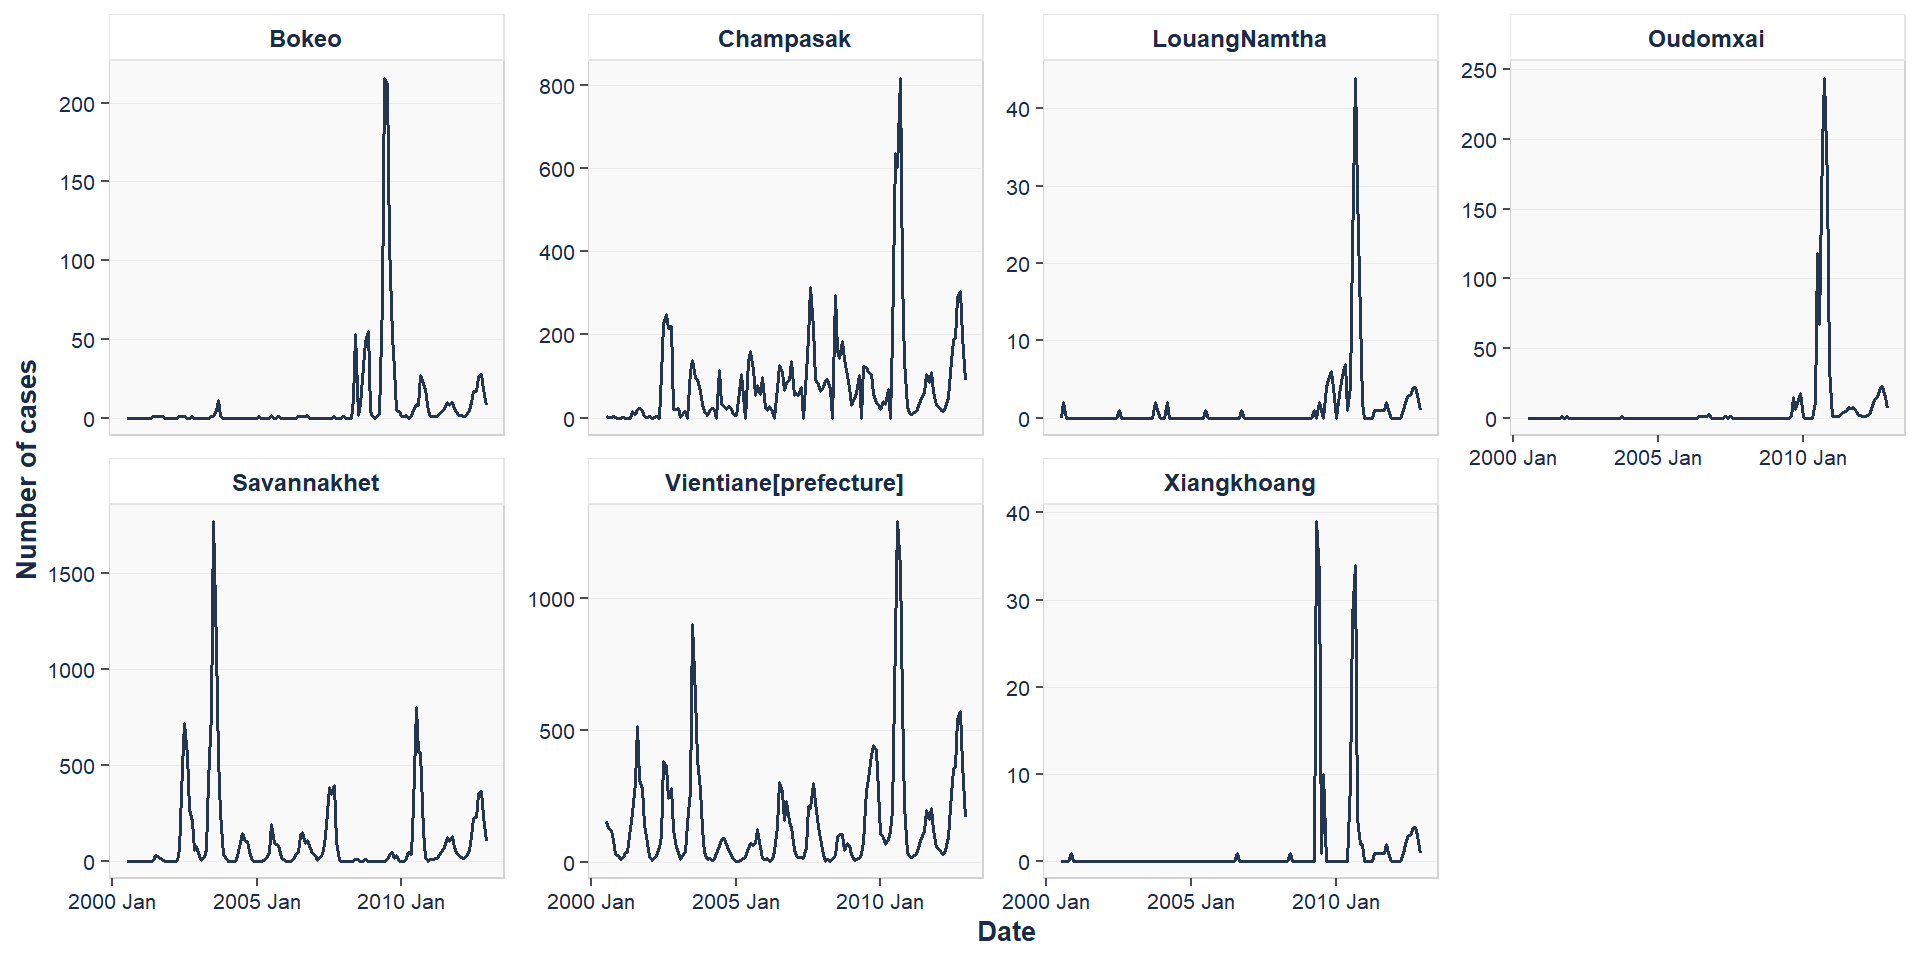
Figure 1: Monthly dengue cases by location.
Ovreall point forecast performance across forecast origins
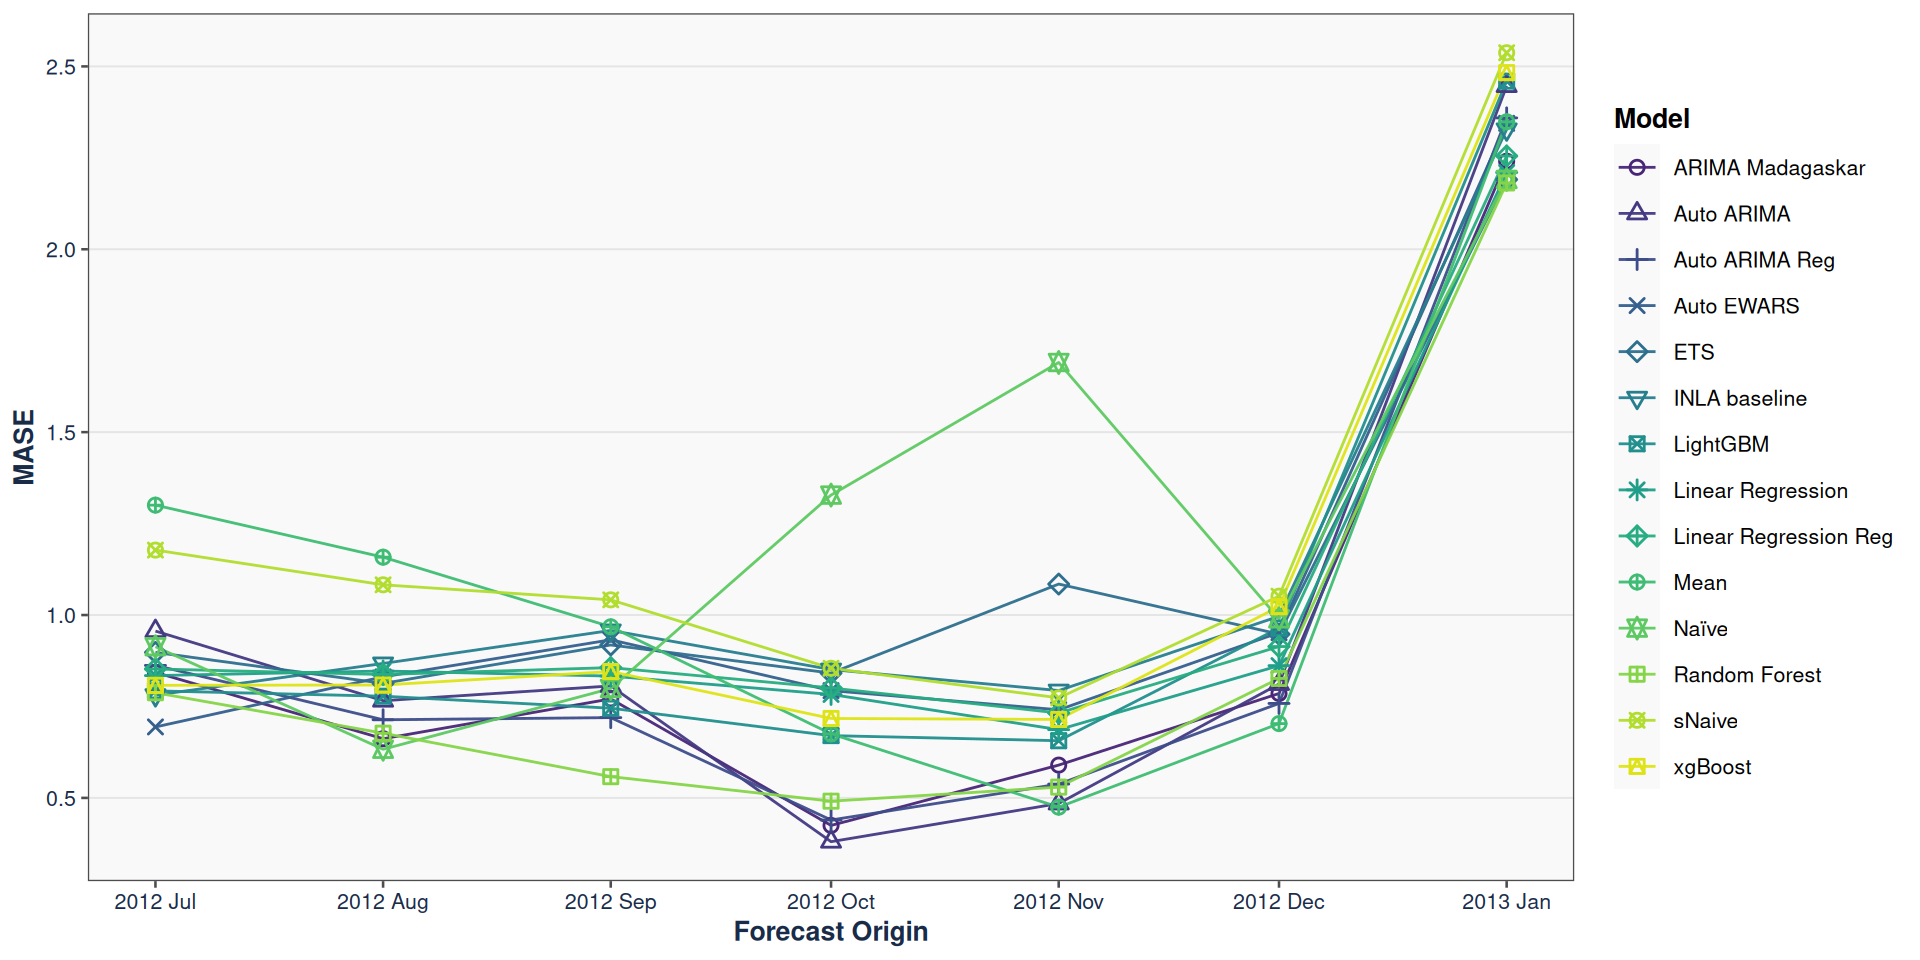
Figure 2: Overall MASE accross forecast origins
Ovreall point forecast performance across each location
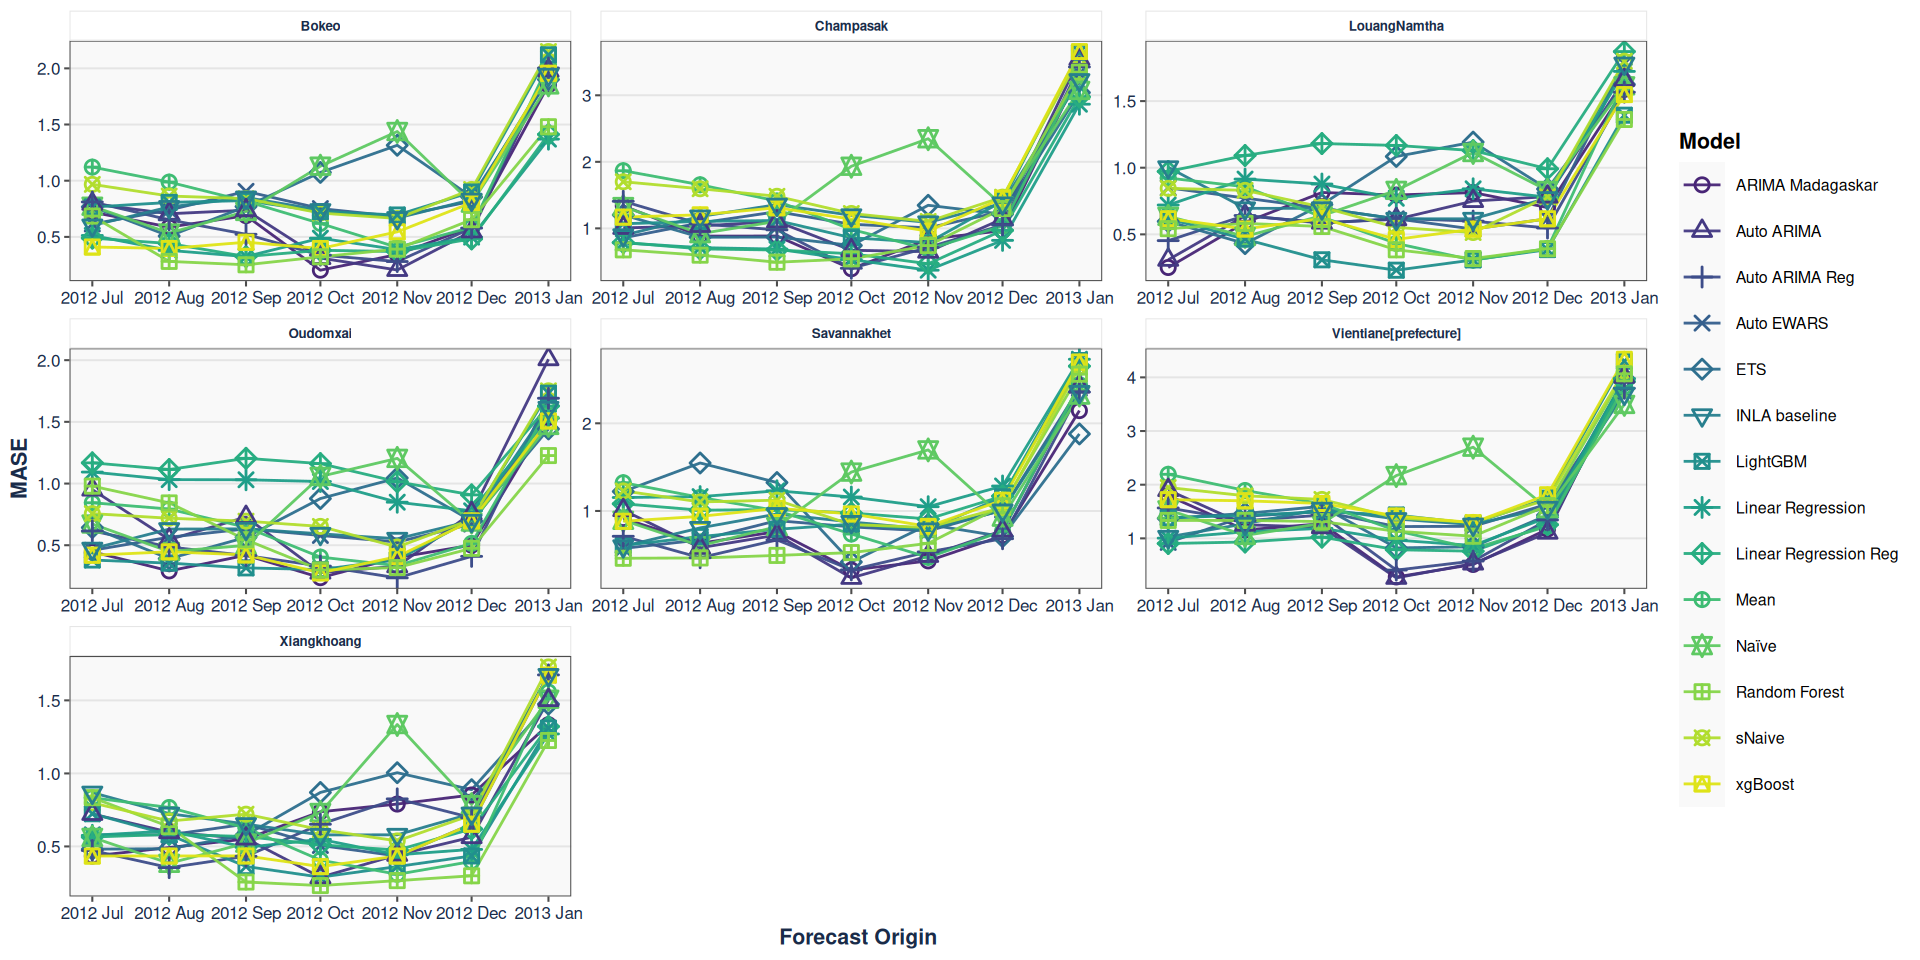
Figure 3: Overall MASE accross forecast origins for each location.

Way forward
Leverage CHAP/DHIS2 based models for supply chain data.
Evaluate forecast perfromance based on time series structure, region and across products.
Run order up-to-level based inventory simulations.
Evaluate how forecast performance translate into inventory decisions.

Key takeaways
The Idea: Reusing morbidity models for supply chains is a promising but non-trivial opportunity.
Our Contribution: We’re building an evidence-based, practical guide for when and how to repurpose morbidity models for consumption forecasting, leveraging CHAP’s modelling infrastructure and DHIS2-linked data.
The Impact: By aligning forecasts with operational decisions, this work aims to improve stock availability, and inform sourcing/procurement decisions.
Compatibility: CHAP/DHIS2’s external model interface makes it possible to integrate these forecasting tools seamlessly, no new platform required.
Any questions or thoughts? 💬