![]()
![]()


Outline
Motivation: why this problem matters
The planning reality
Why TSFMs look attractive
Forecast quality beyond accuracy
Experimental design and results
Where this work goes next

What the planning reality looks like
“Forecasting tools exist, but the last-mile planning reality is still Excel, paper forms, manual adjustments, and fragmented systems.”
Ethiopia field visit and collaborator feedback
“A tool can be ‘in use’, but only in a limited scope, during a project period, or in central sites, without scaling to the whole country.”
DHIS2/HISP collaborator feedback

Why time series foundation models look attractive
- Public health systems have many related but weak individual time series.
- TSFMs may transfer learned temporal patterns from large-scale pretraining.
- They can reduce the need for long local histories, manual feature engineering, and repeated local model building.
- This creates the potential to democratise forecasting support for facilities where planning is often done by nurses, store managers, or non-specialist staff.
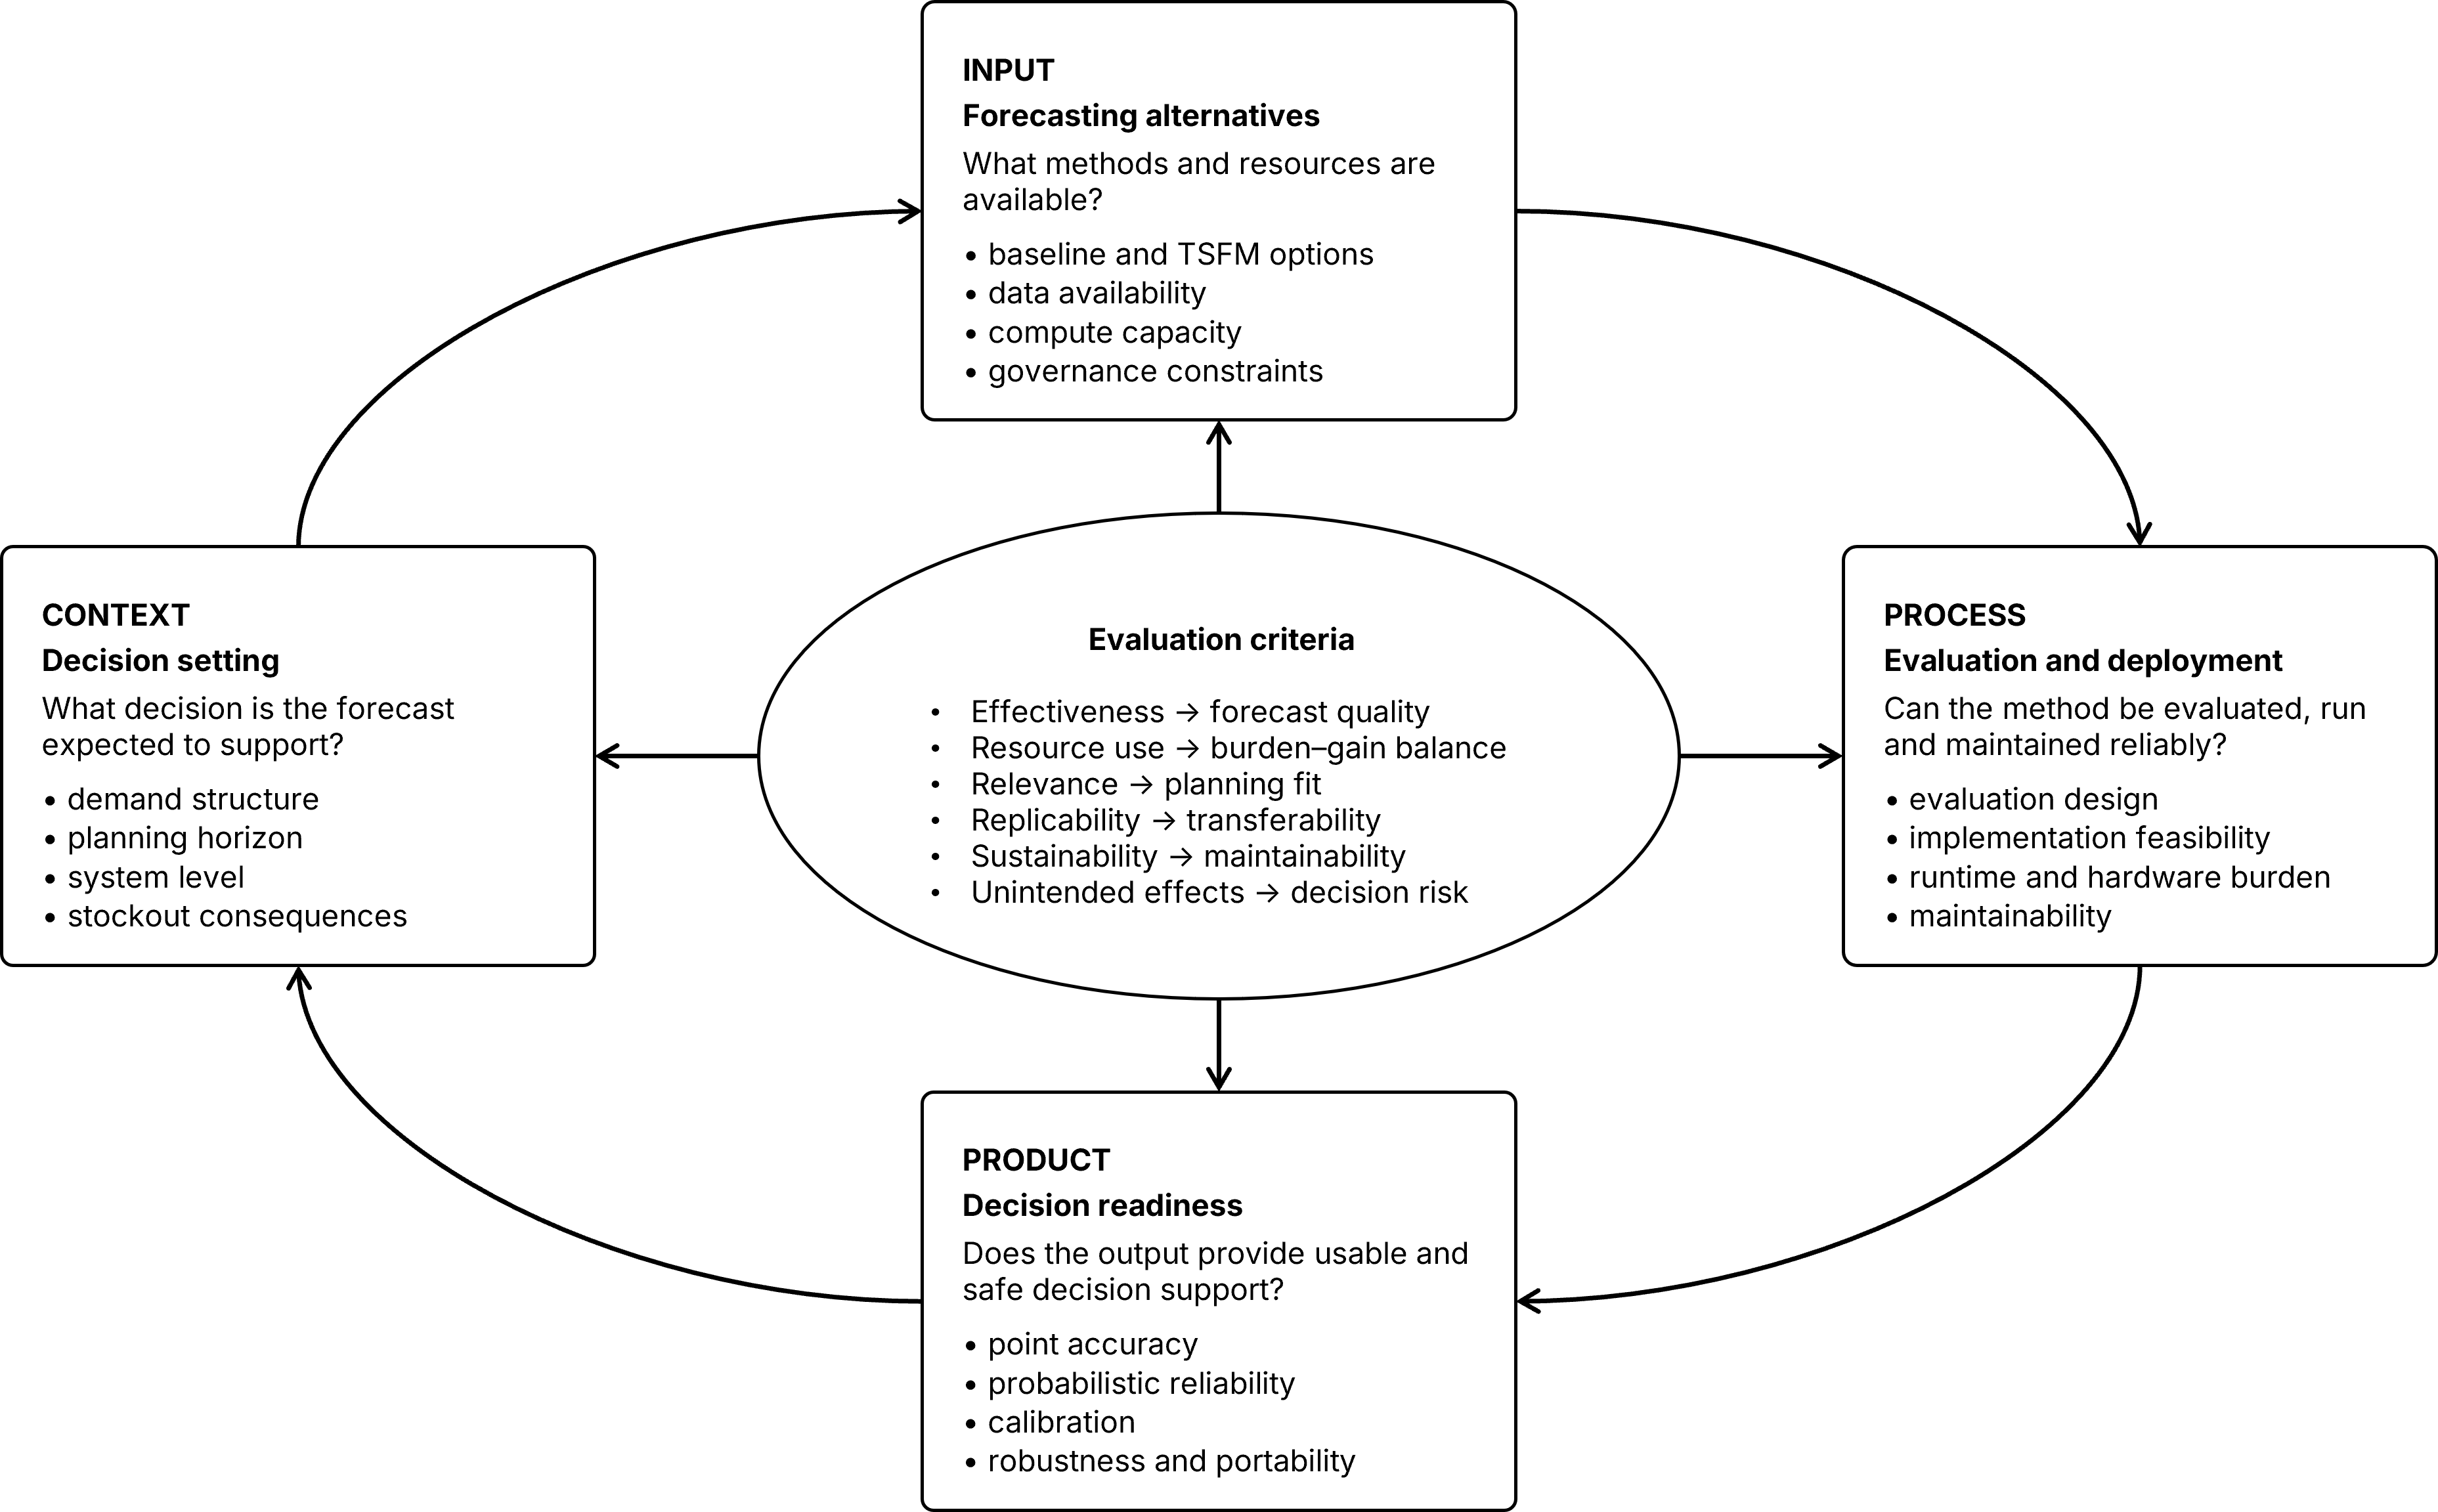
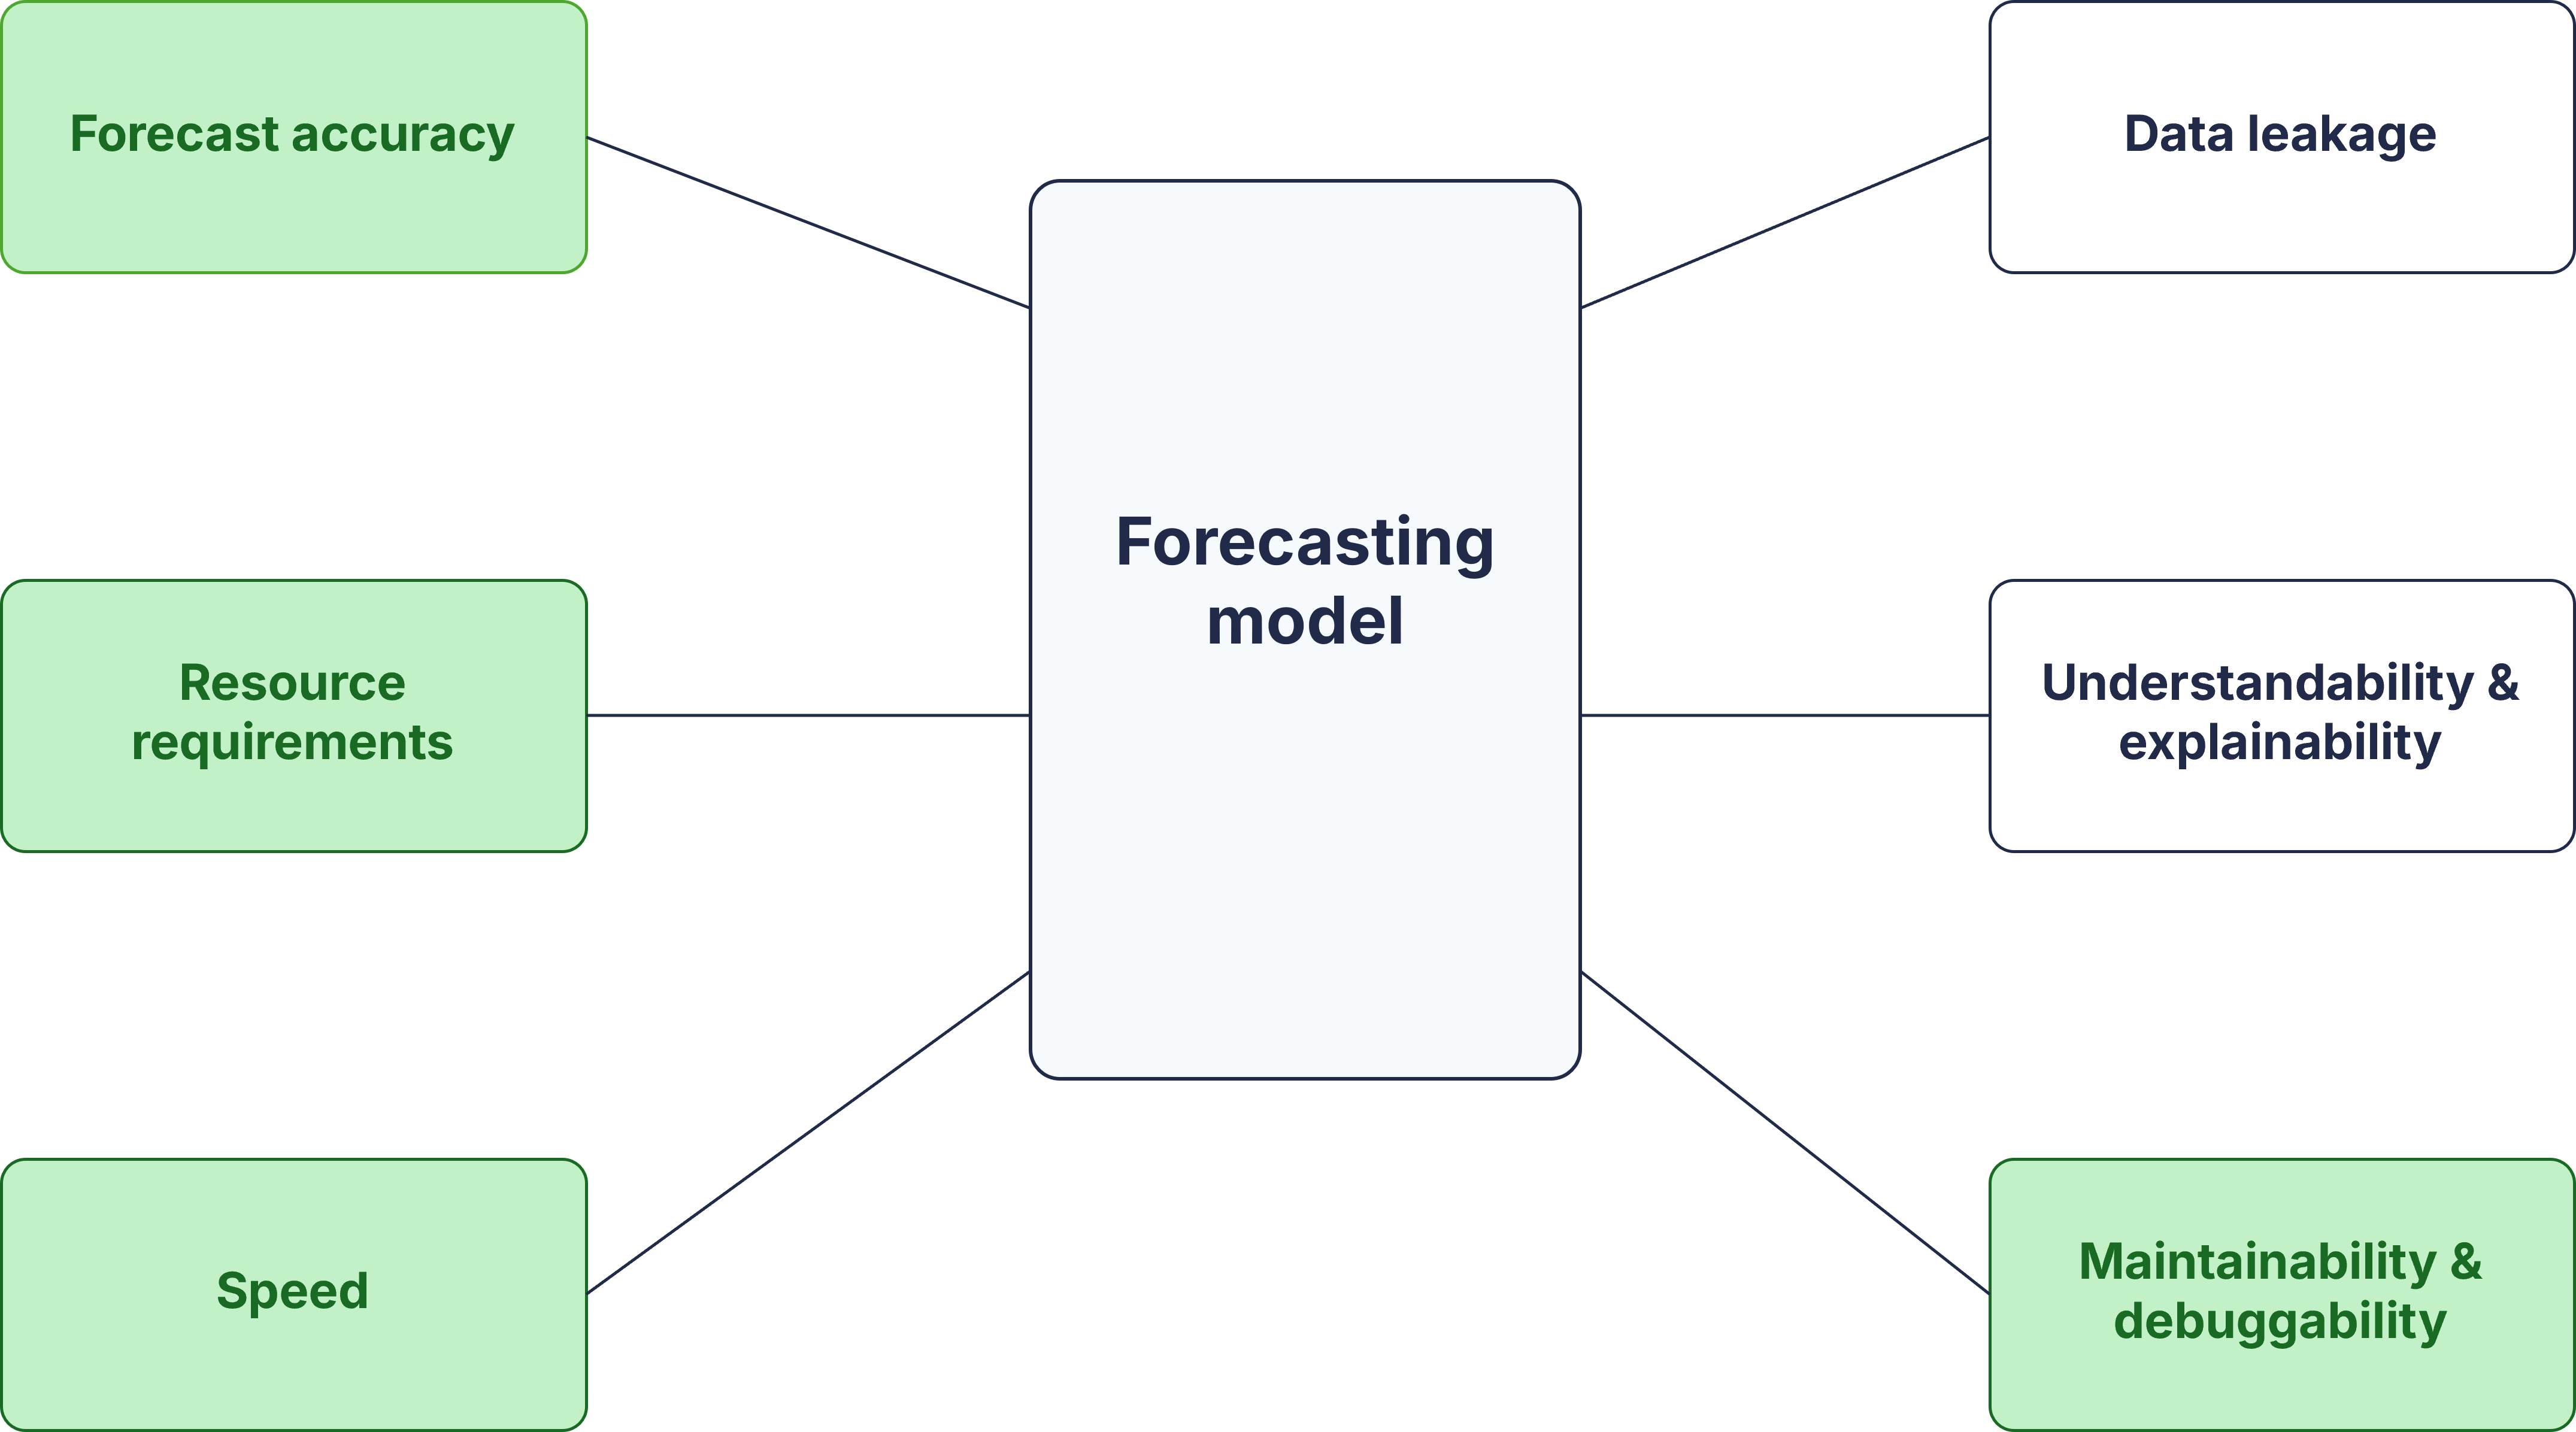
But accuracy is (not) all we need
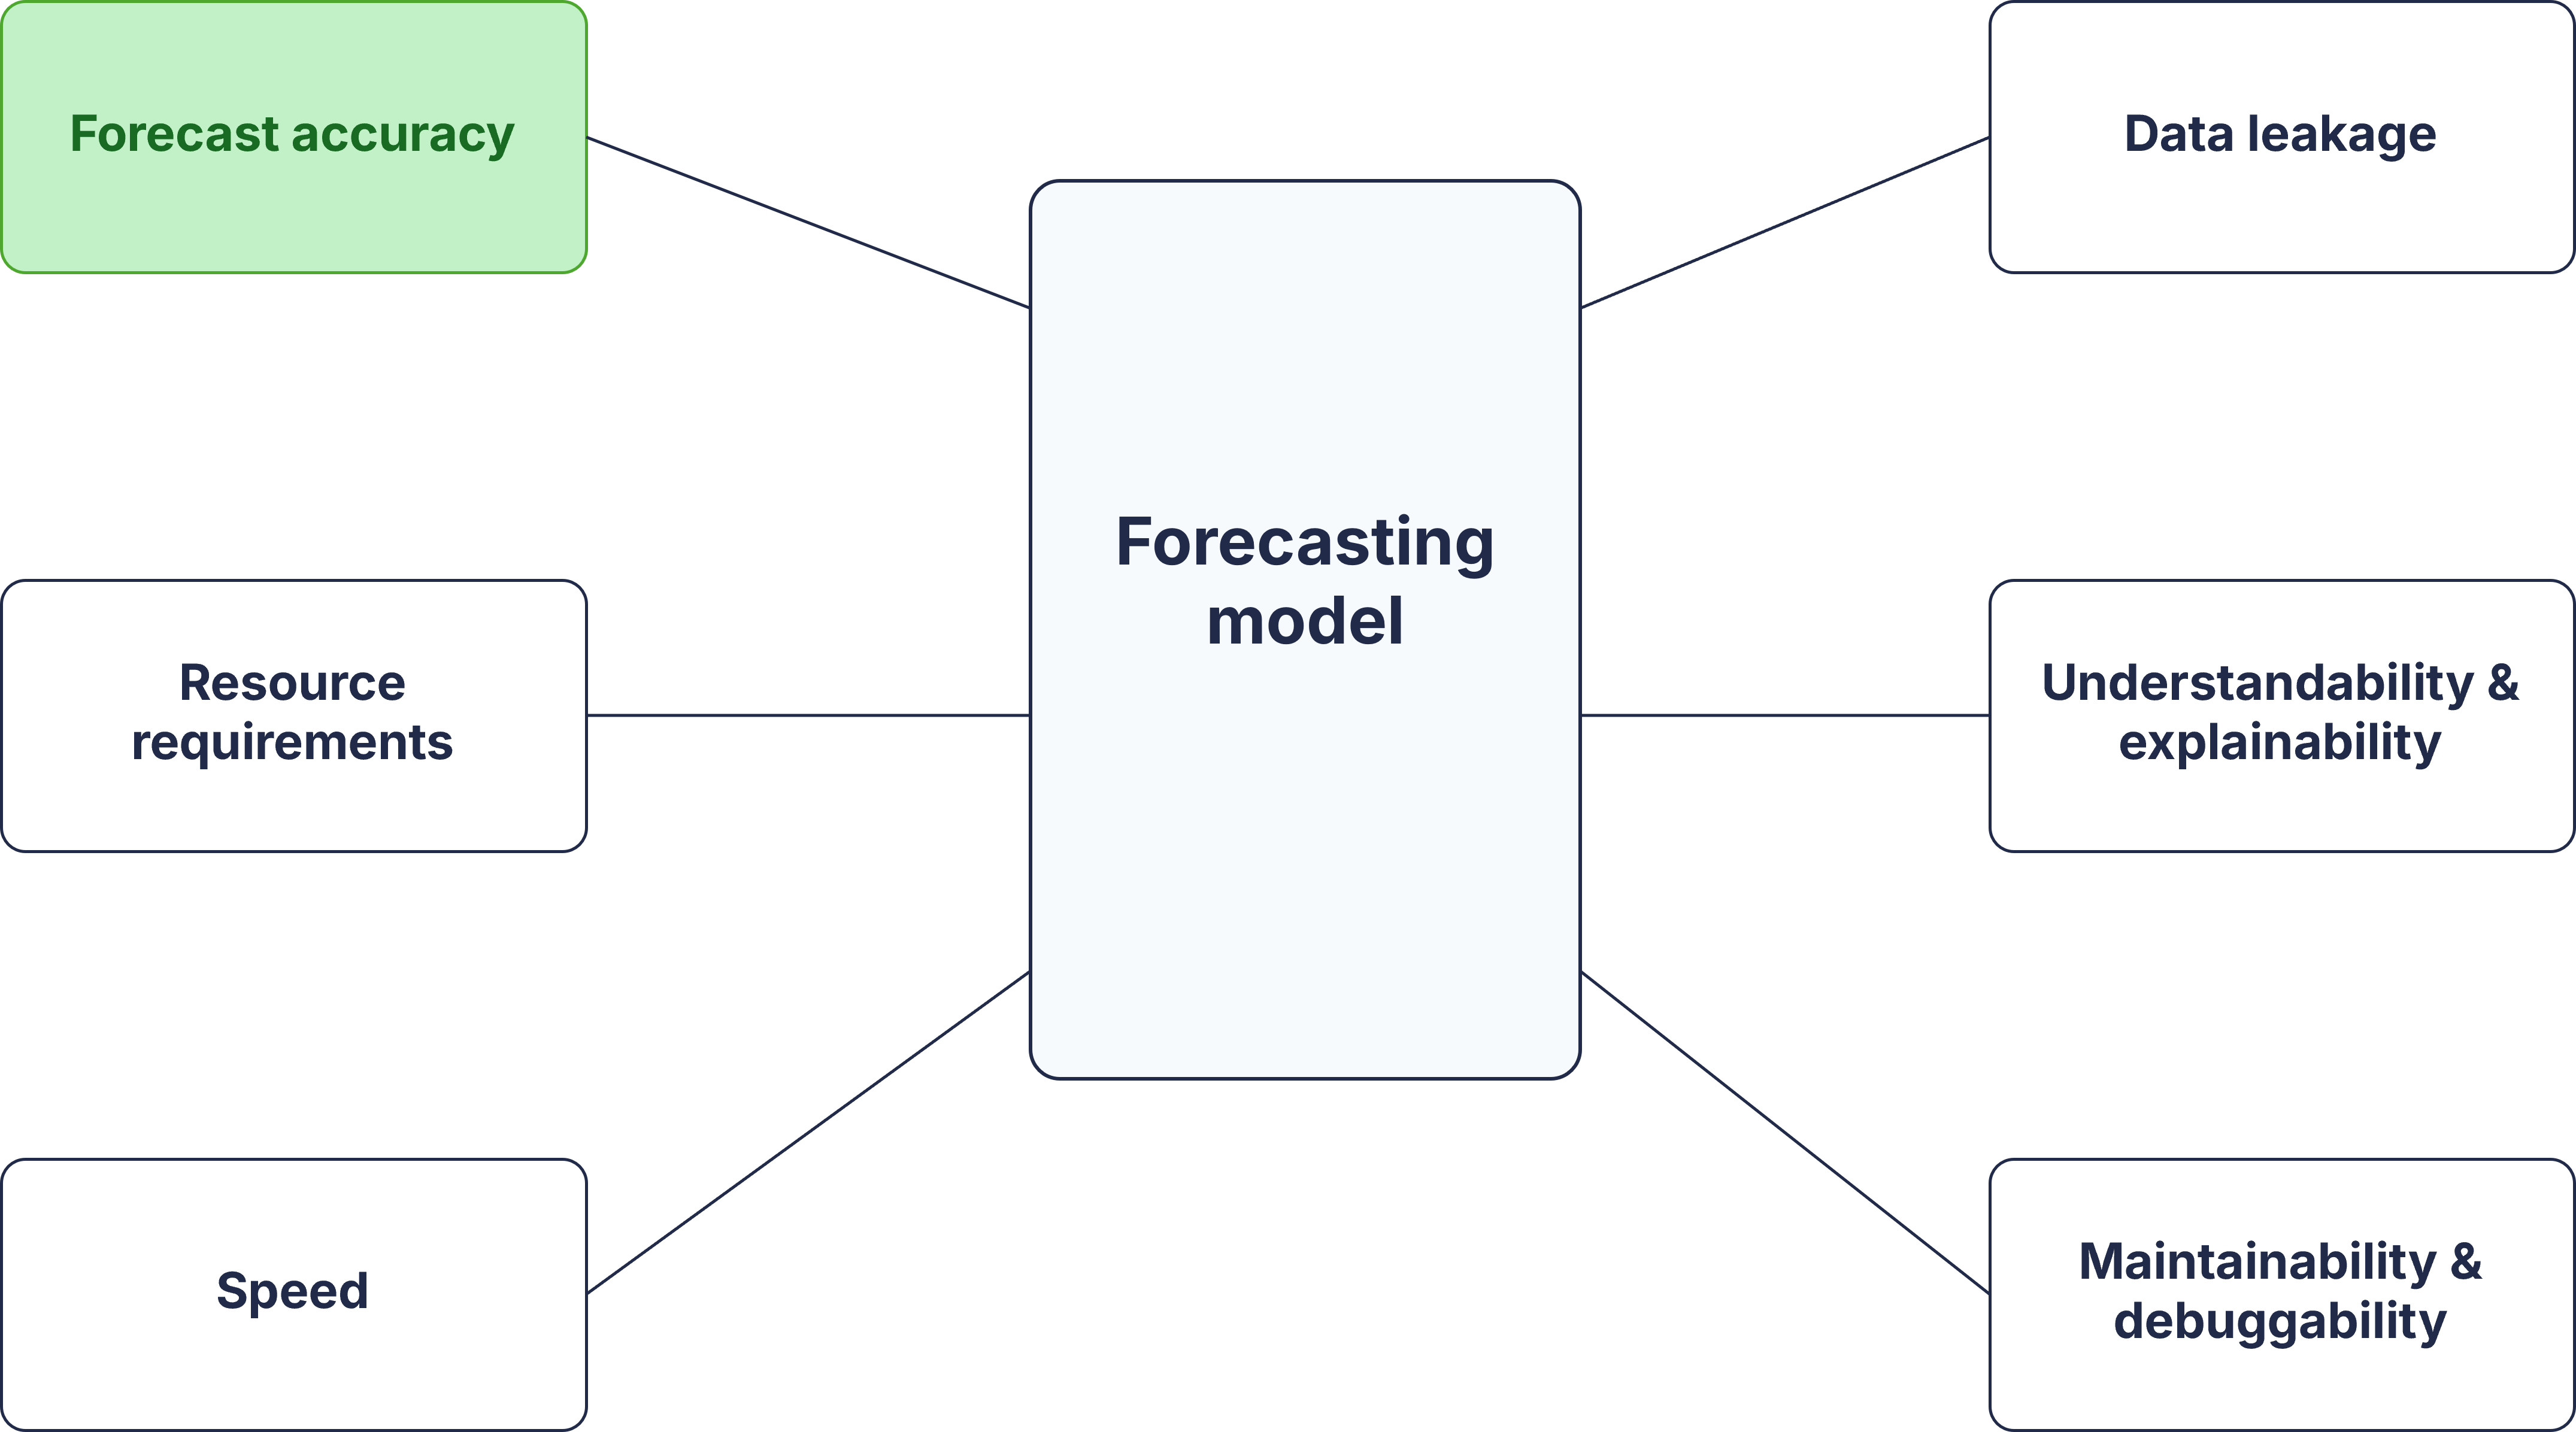
But accuracy is (not) all we need
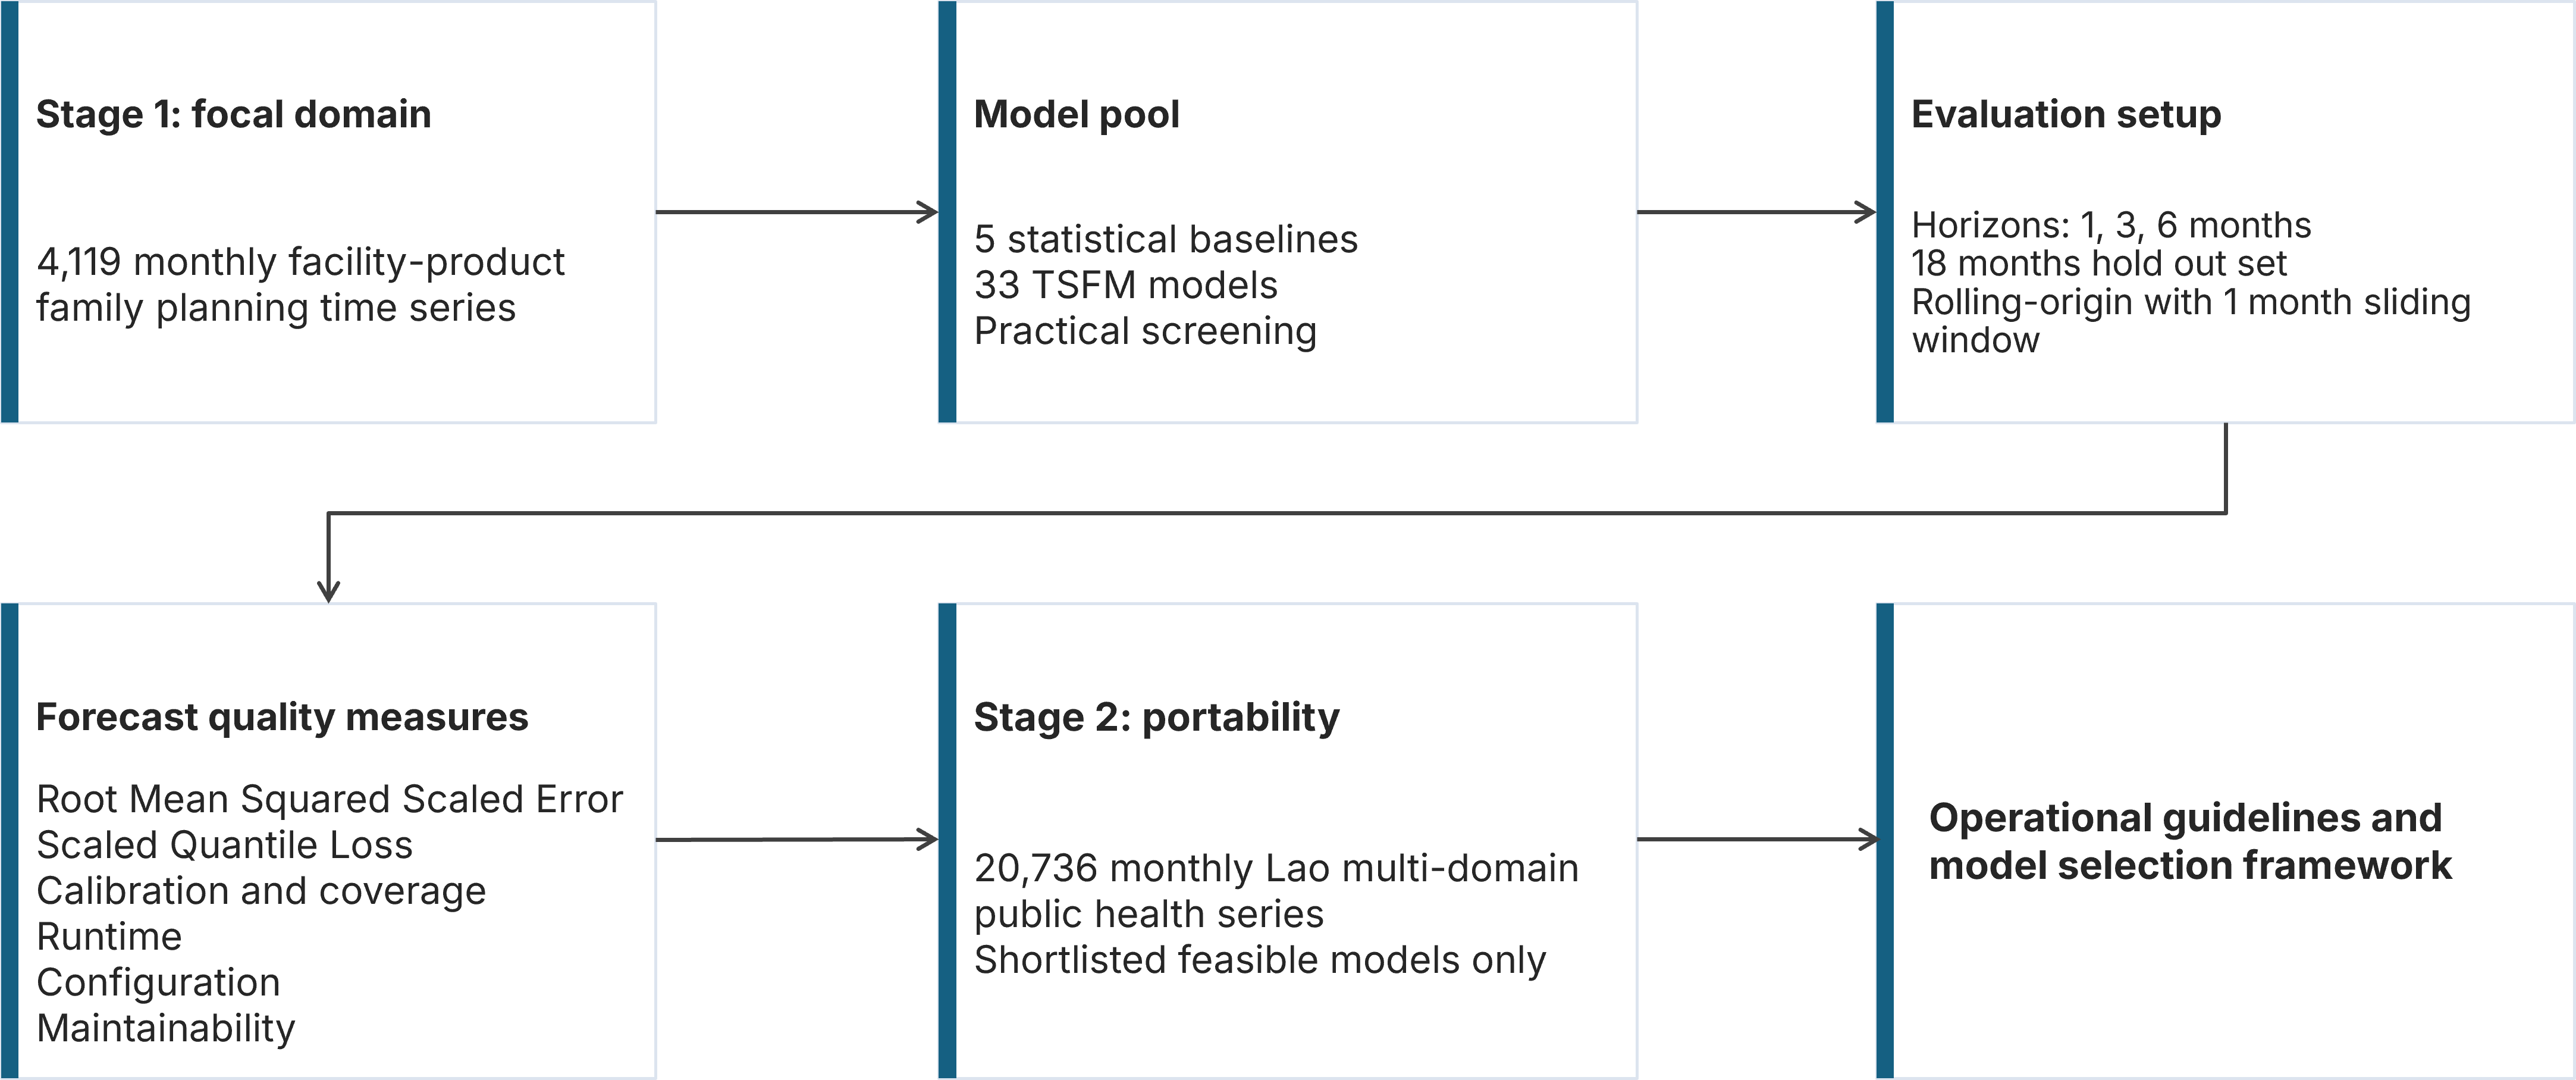
Experimental design

Experimental design

Experimental design
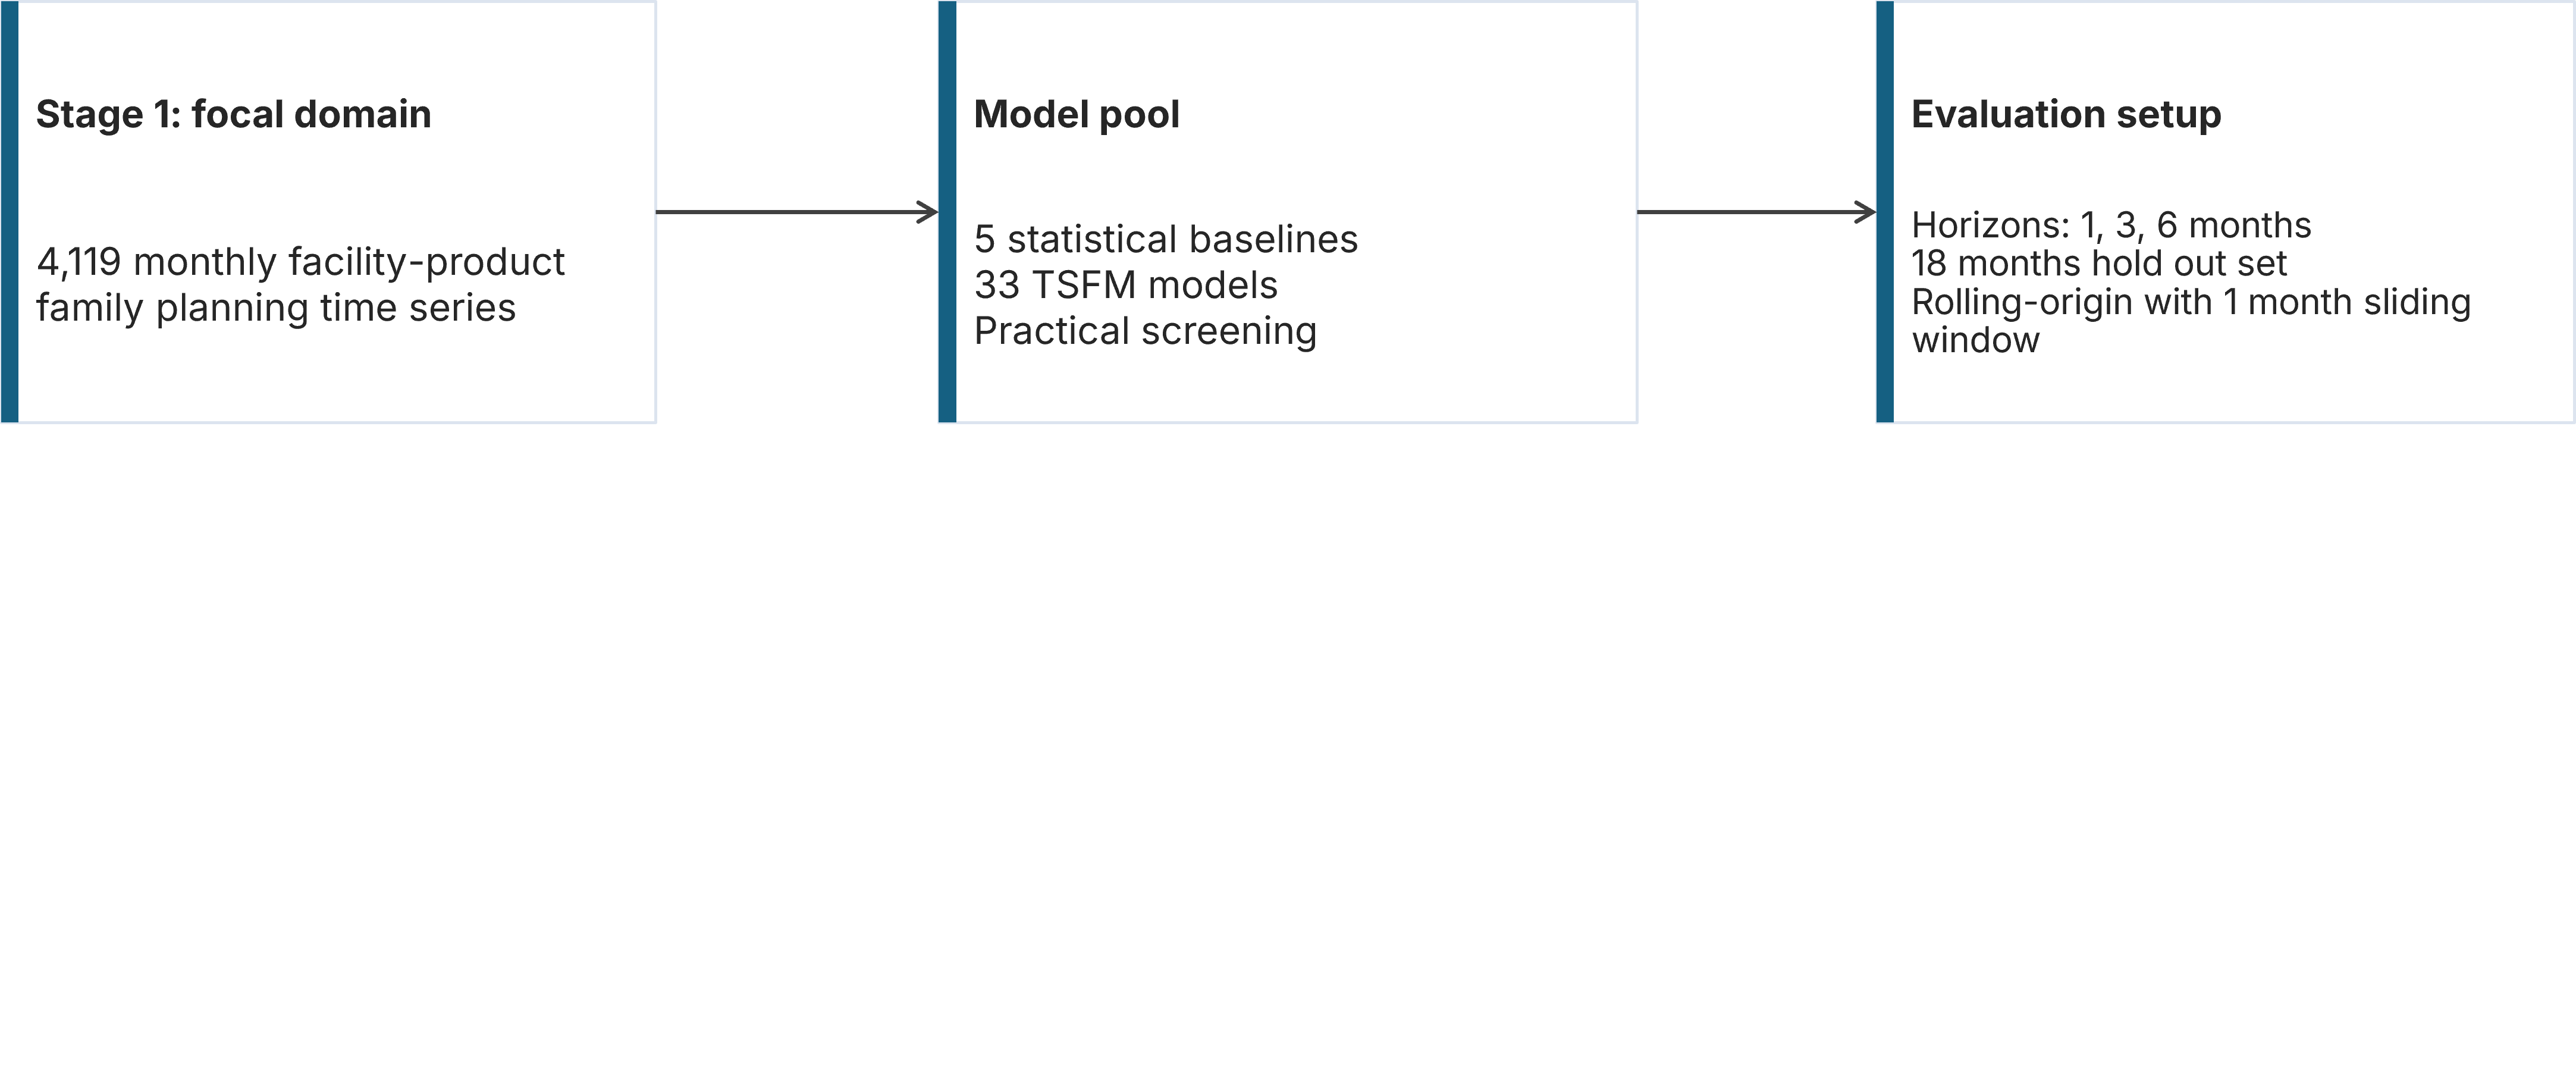
Experimental design
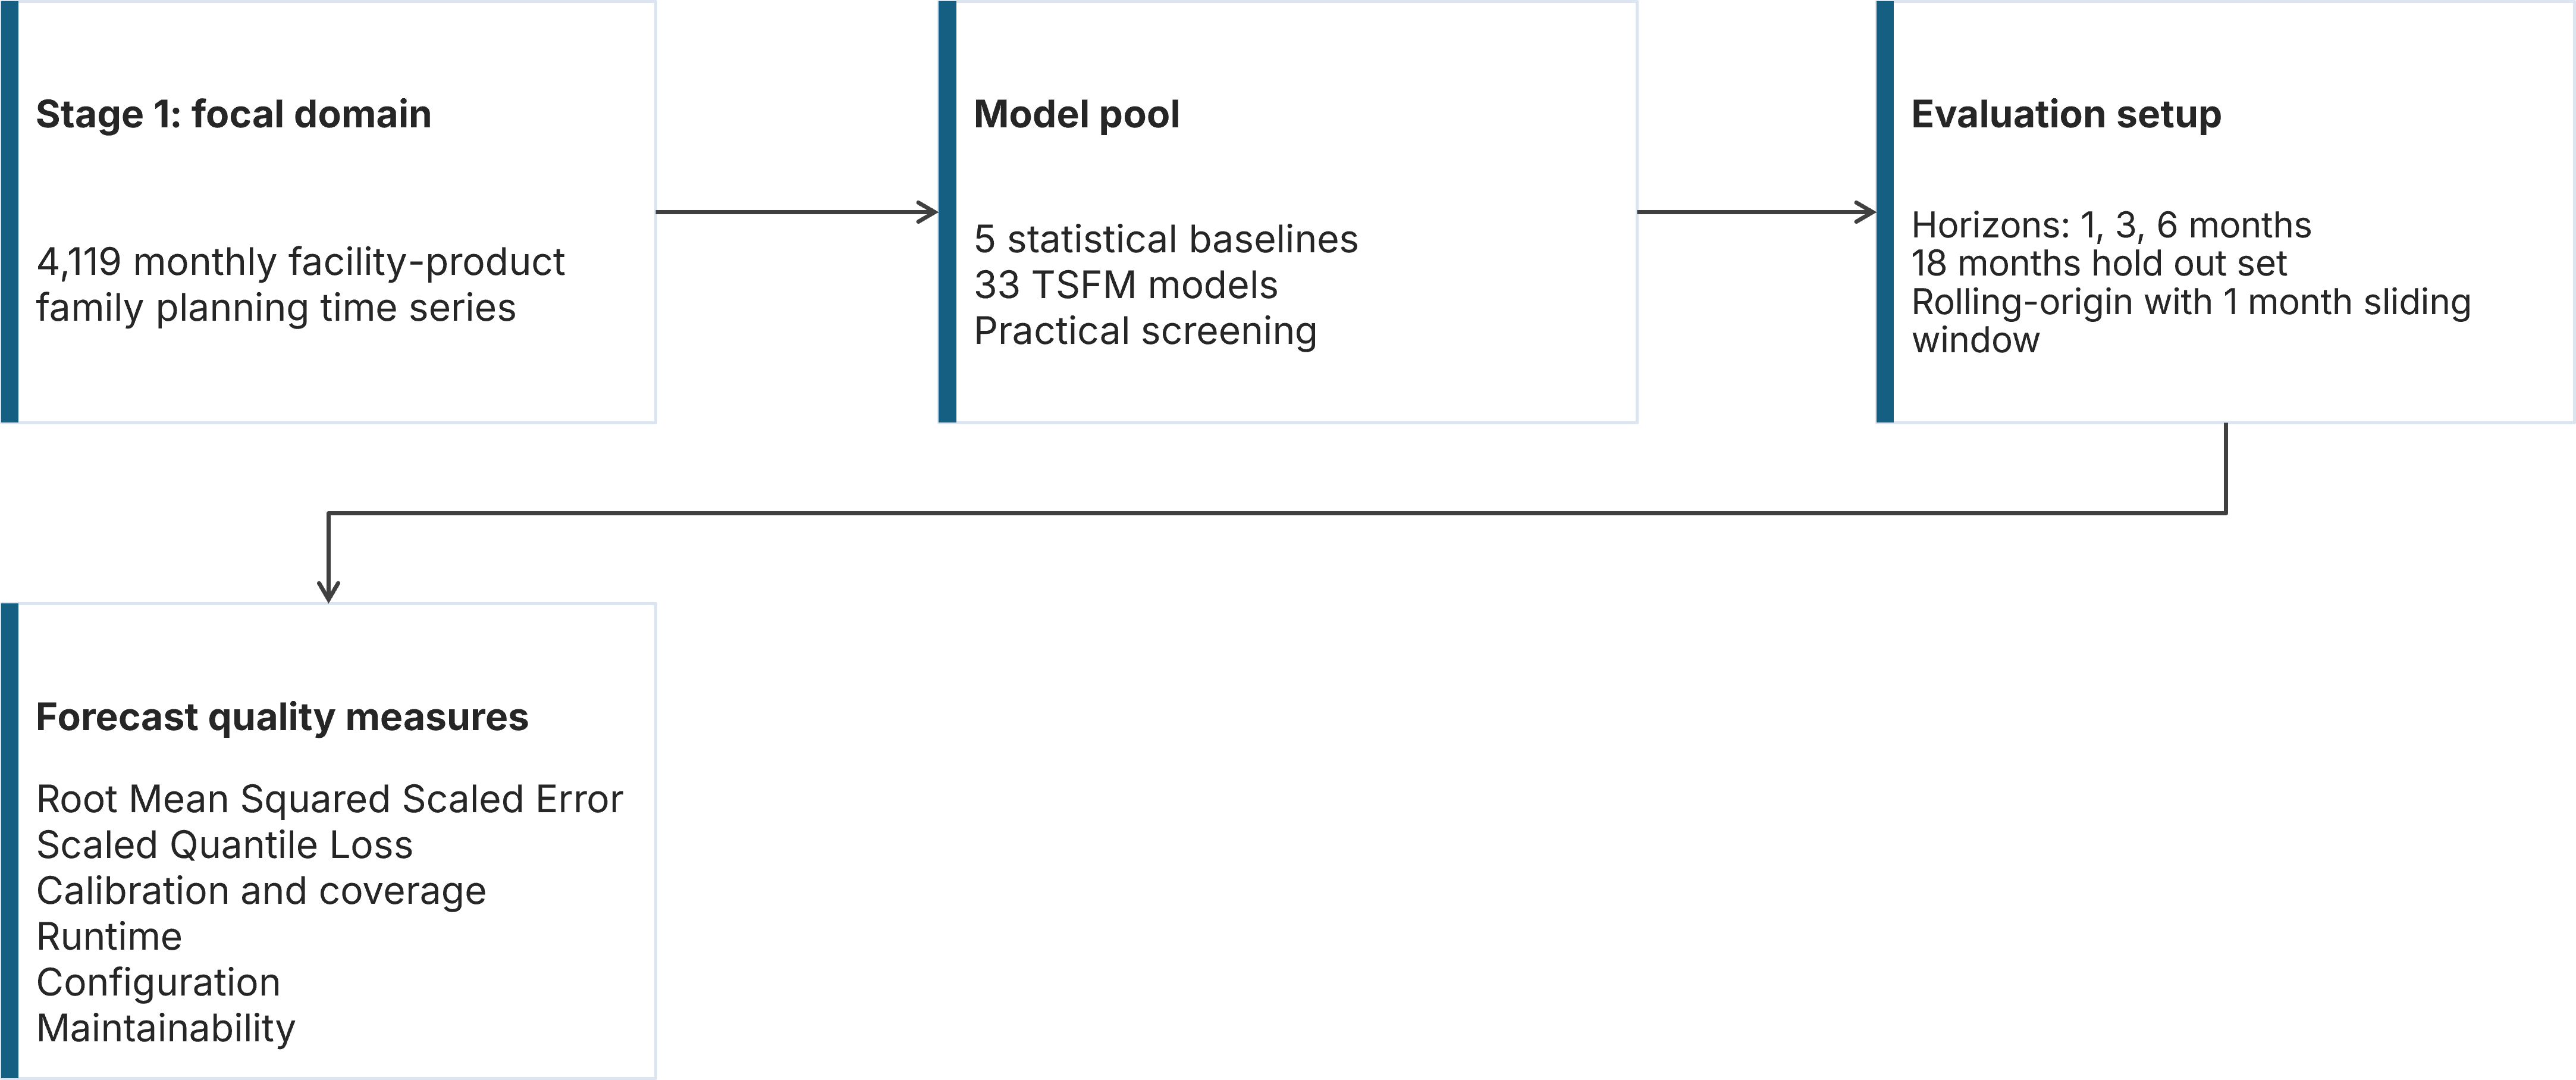
Experimental design
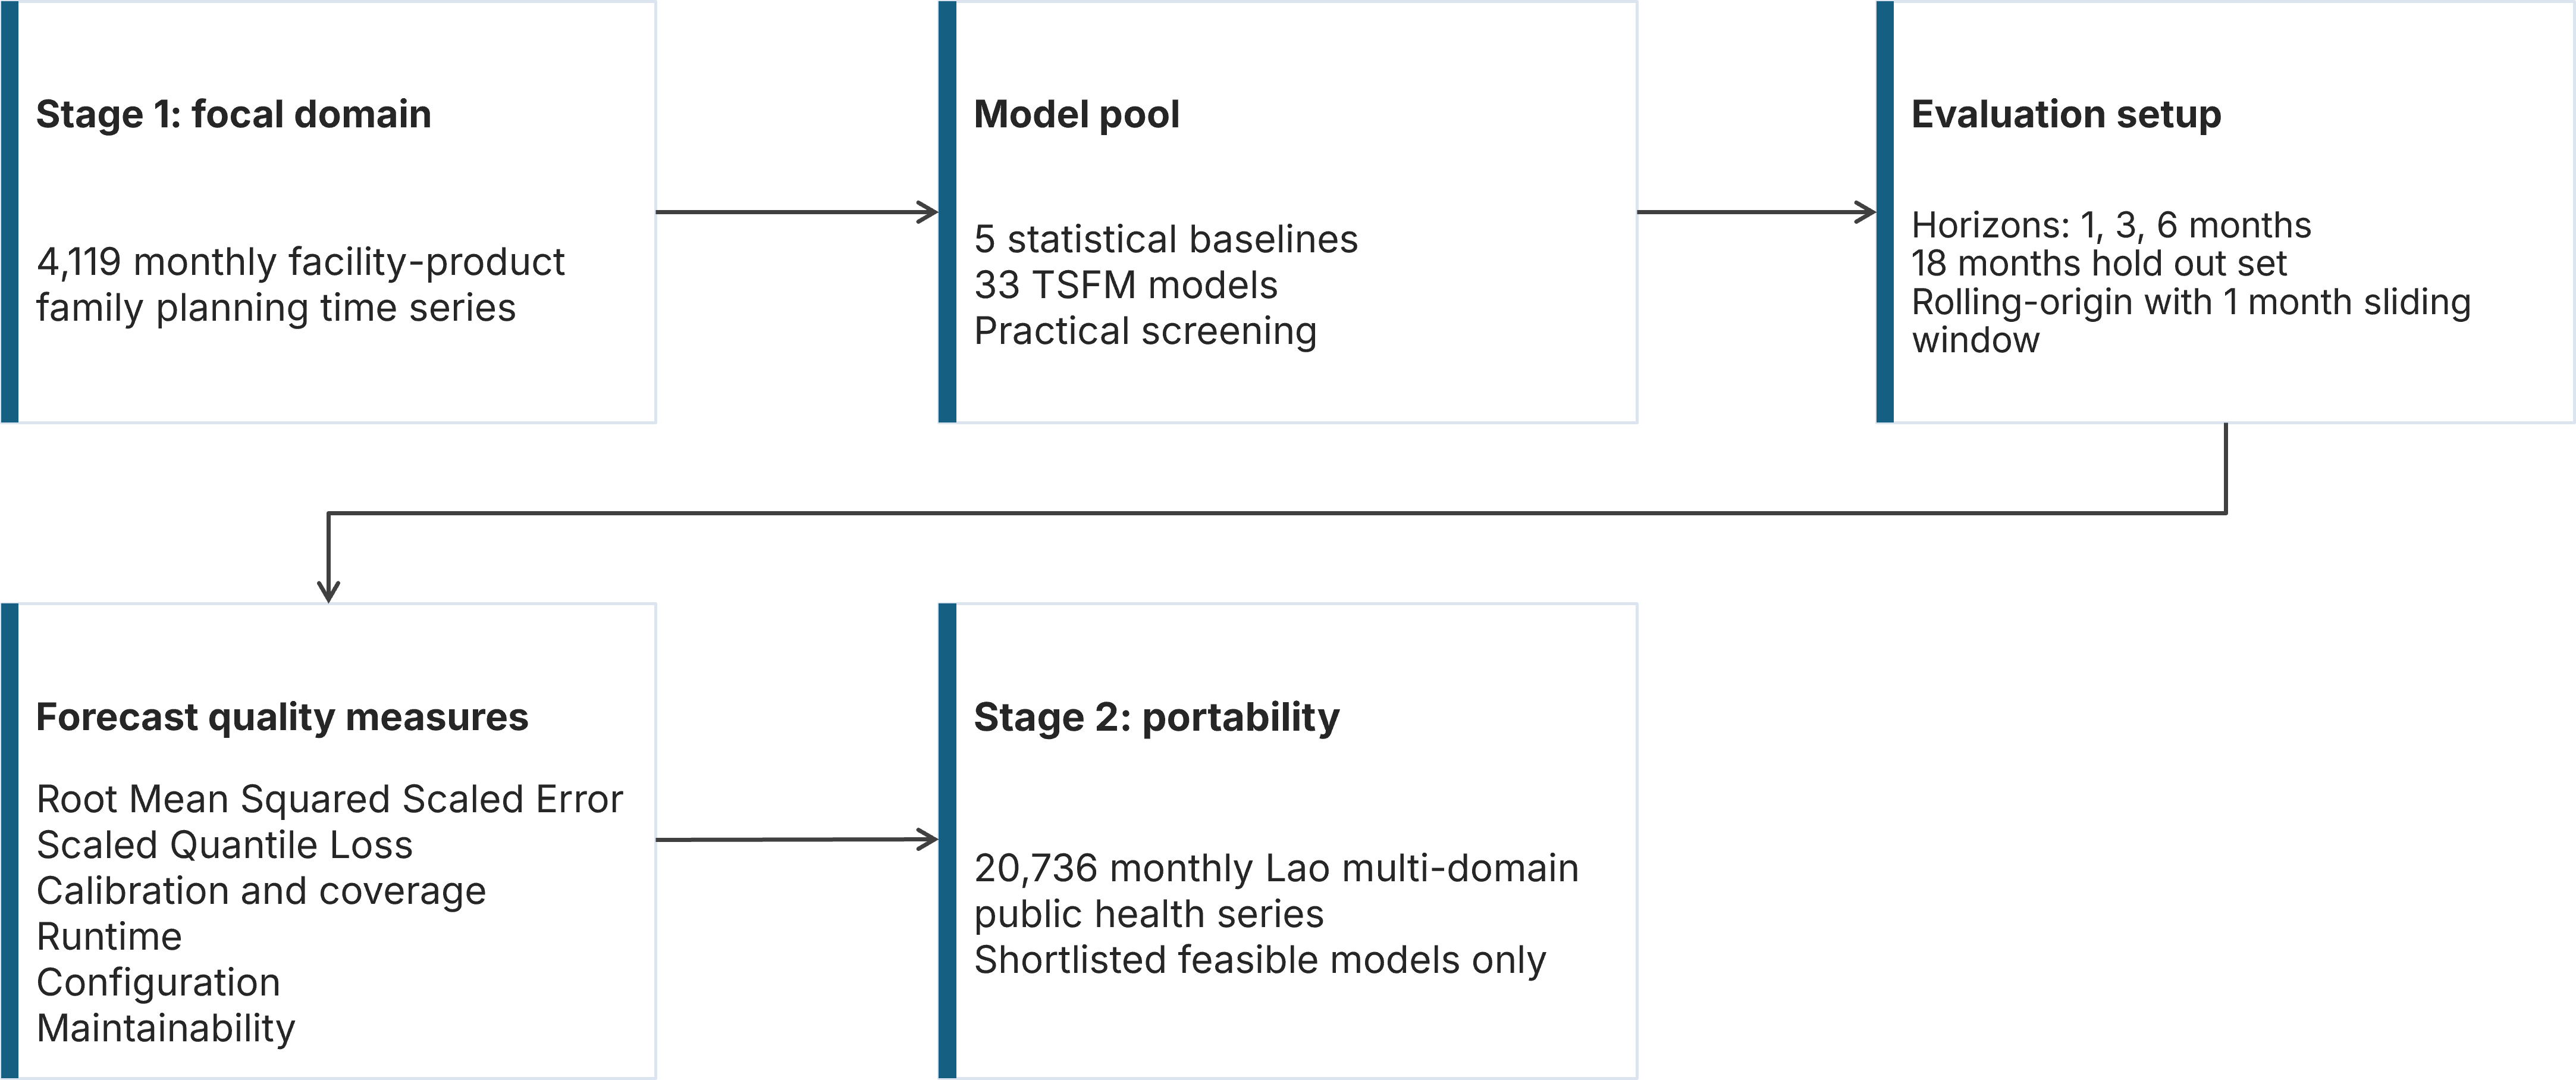
Experimental design
A quick look at the data
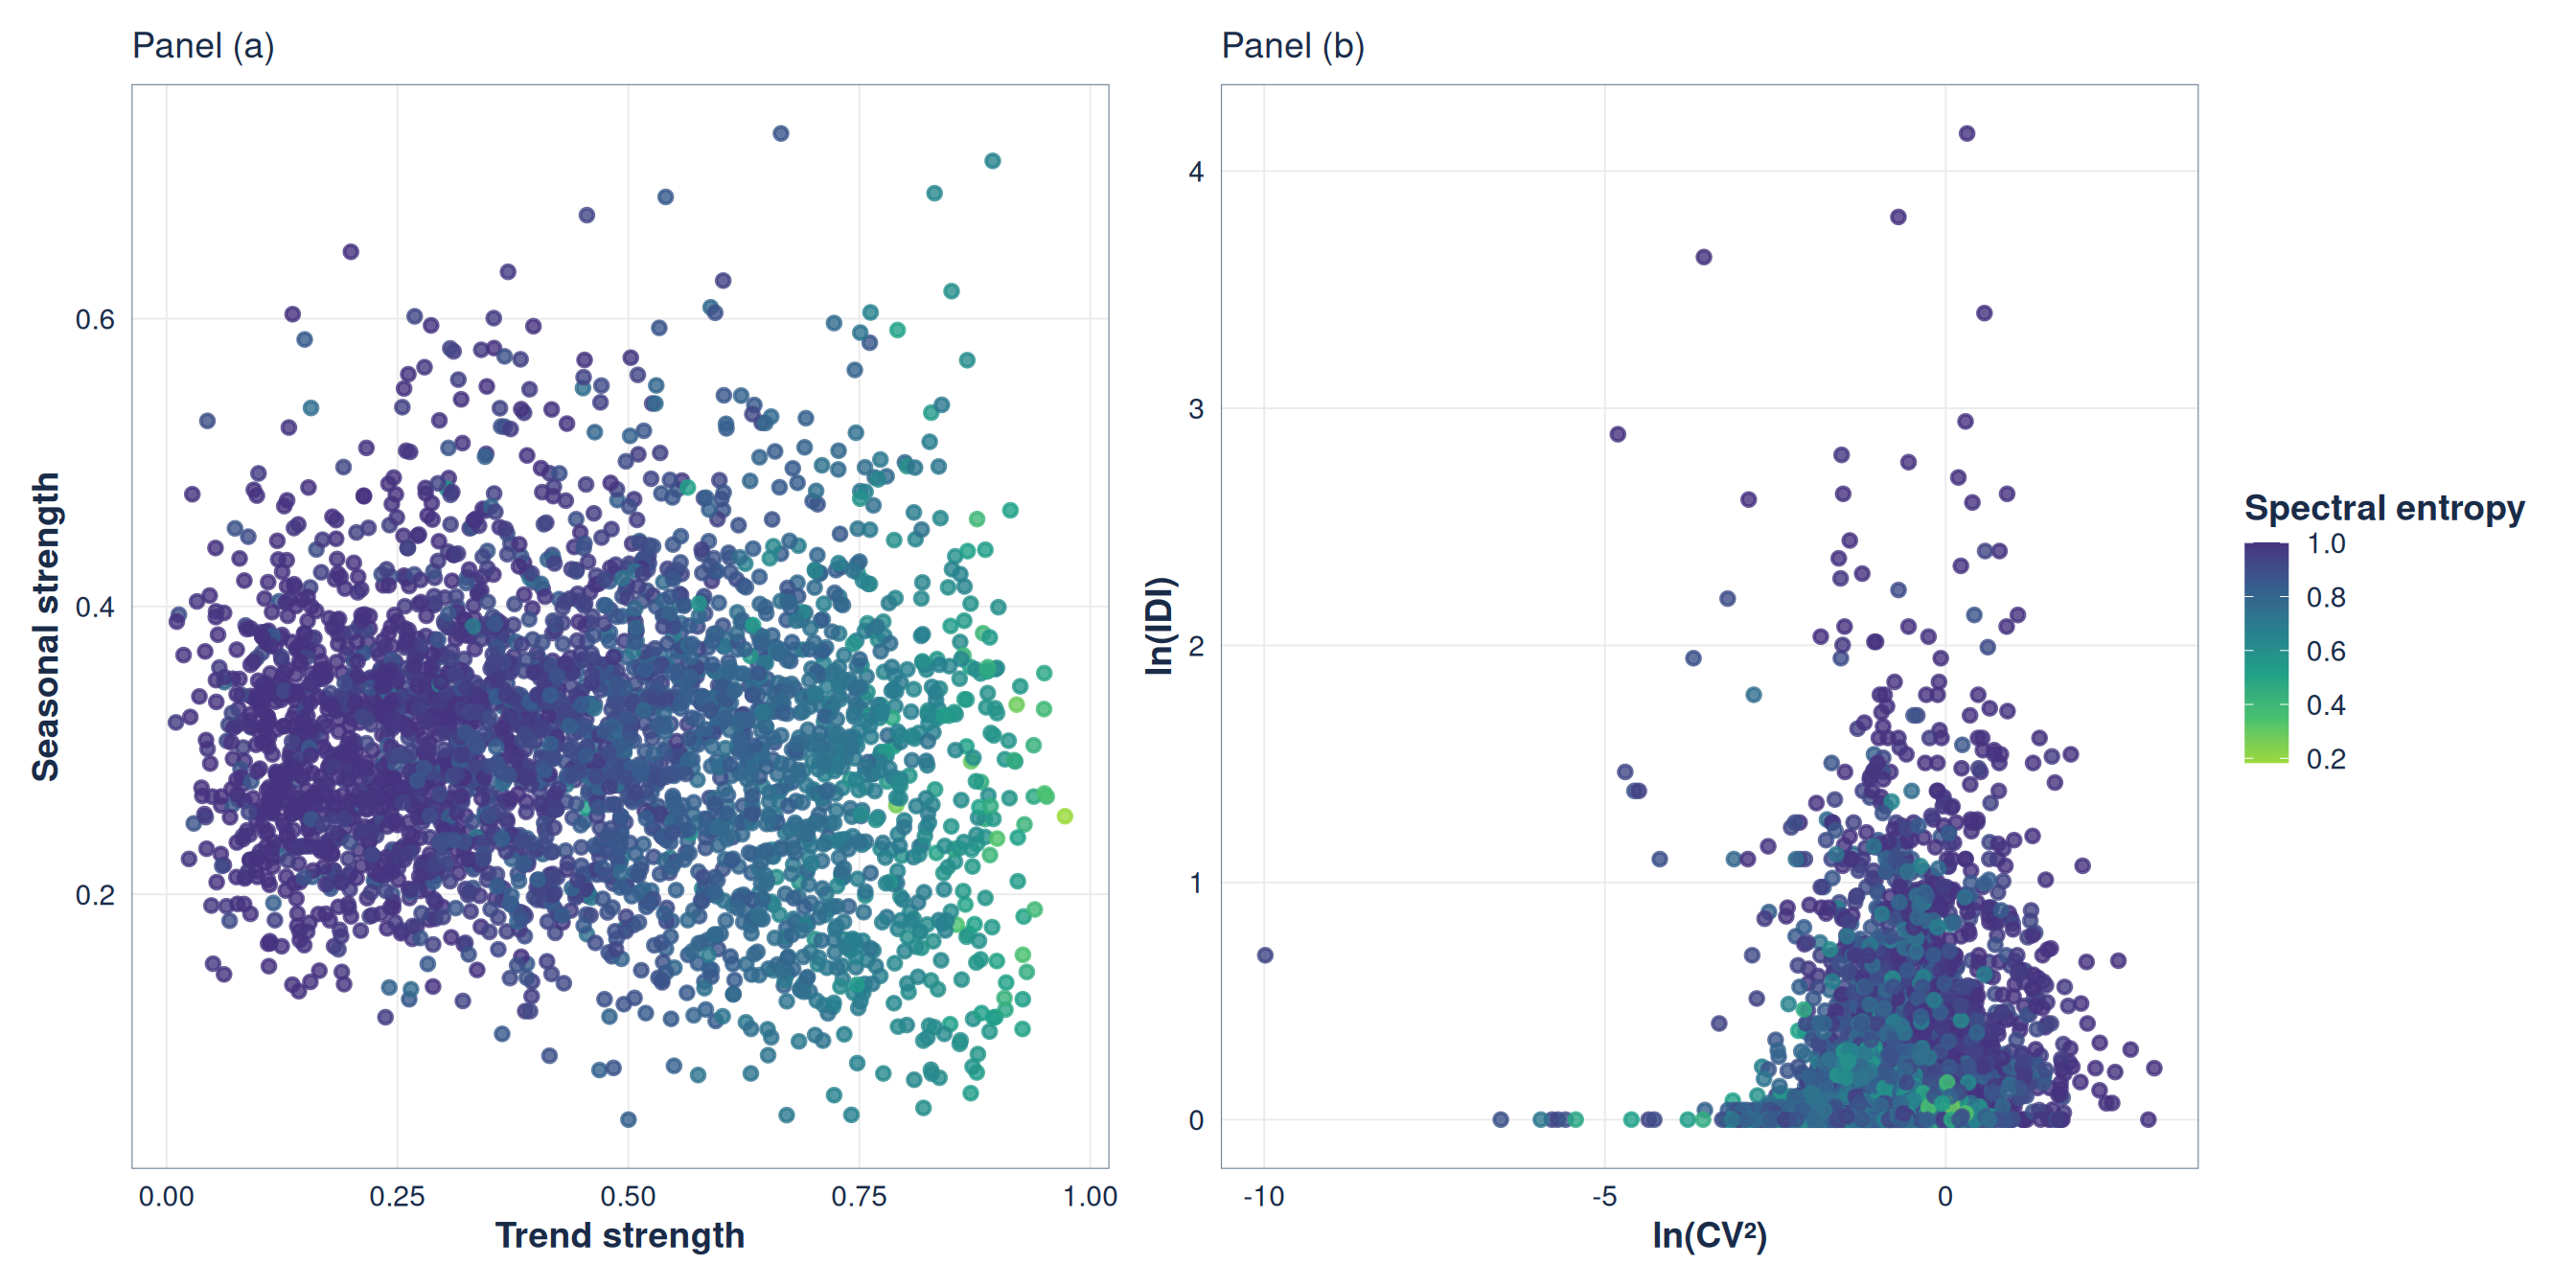
Figure 1: Time series characteristics across the family planning dataset. Panel (a) illustrates trend versus seasonal strength, while Panel (b) displays demand variability against intermittency. The color scale encodes spectral entropy, where lighter colors indicate more predictable, structured dynamics.
TSFMs can improve point accuracy
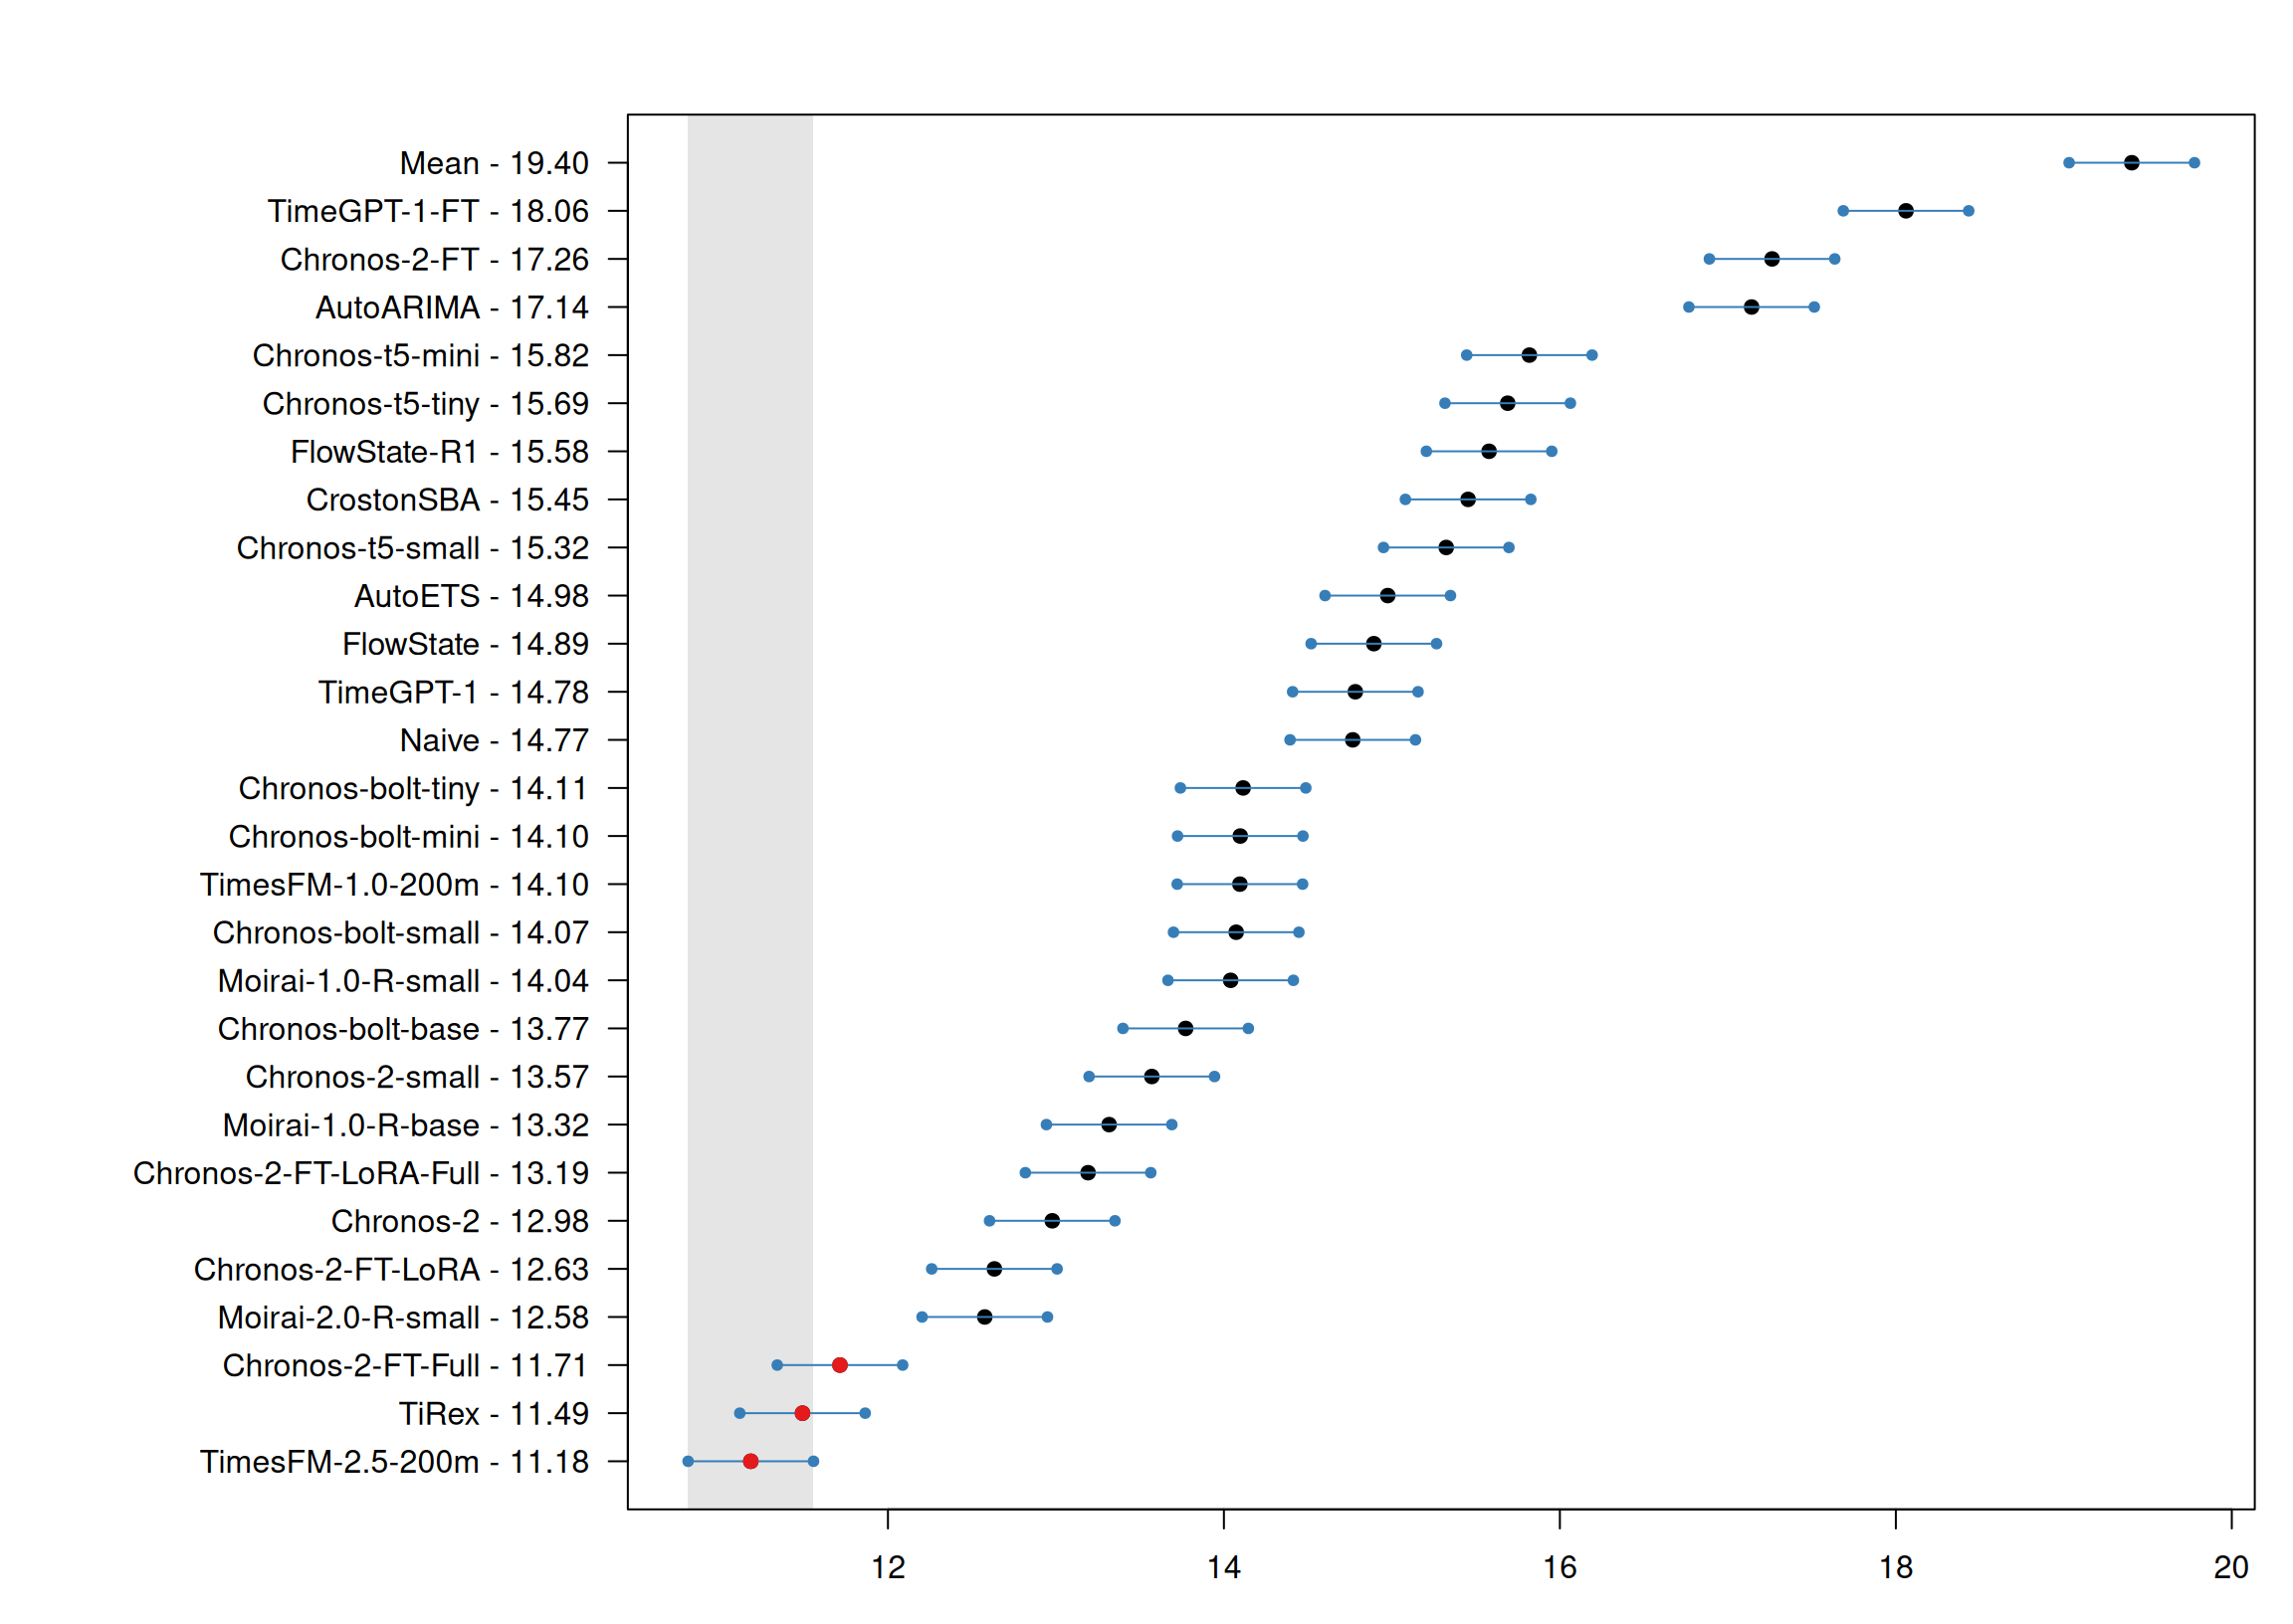
Figure 2: Multiple Comparisons with the Best (MCB) test results for RMSSE.
Probabilistic performance tells a similar story
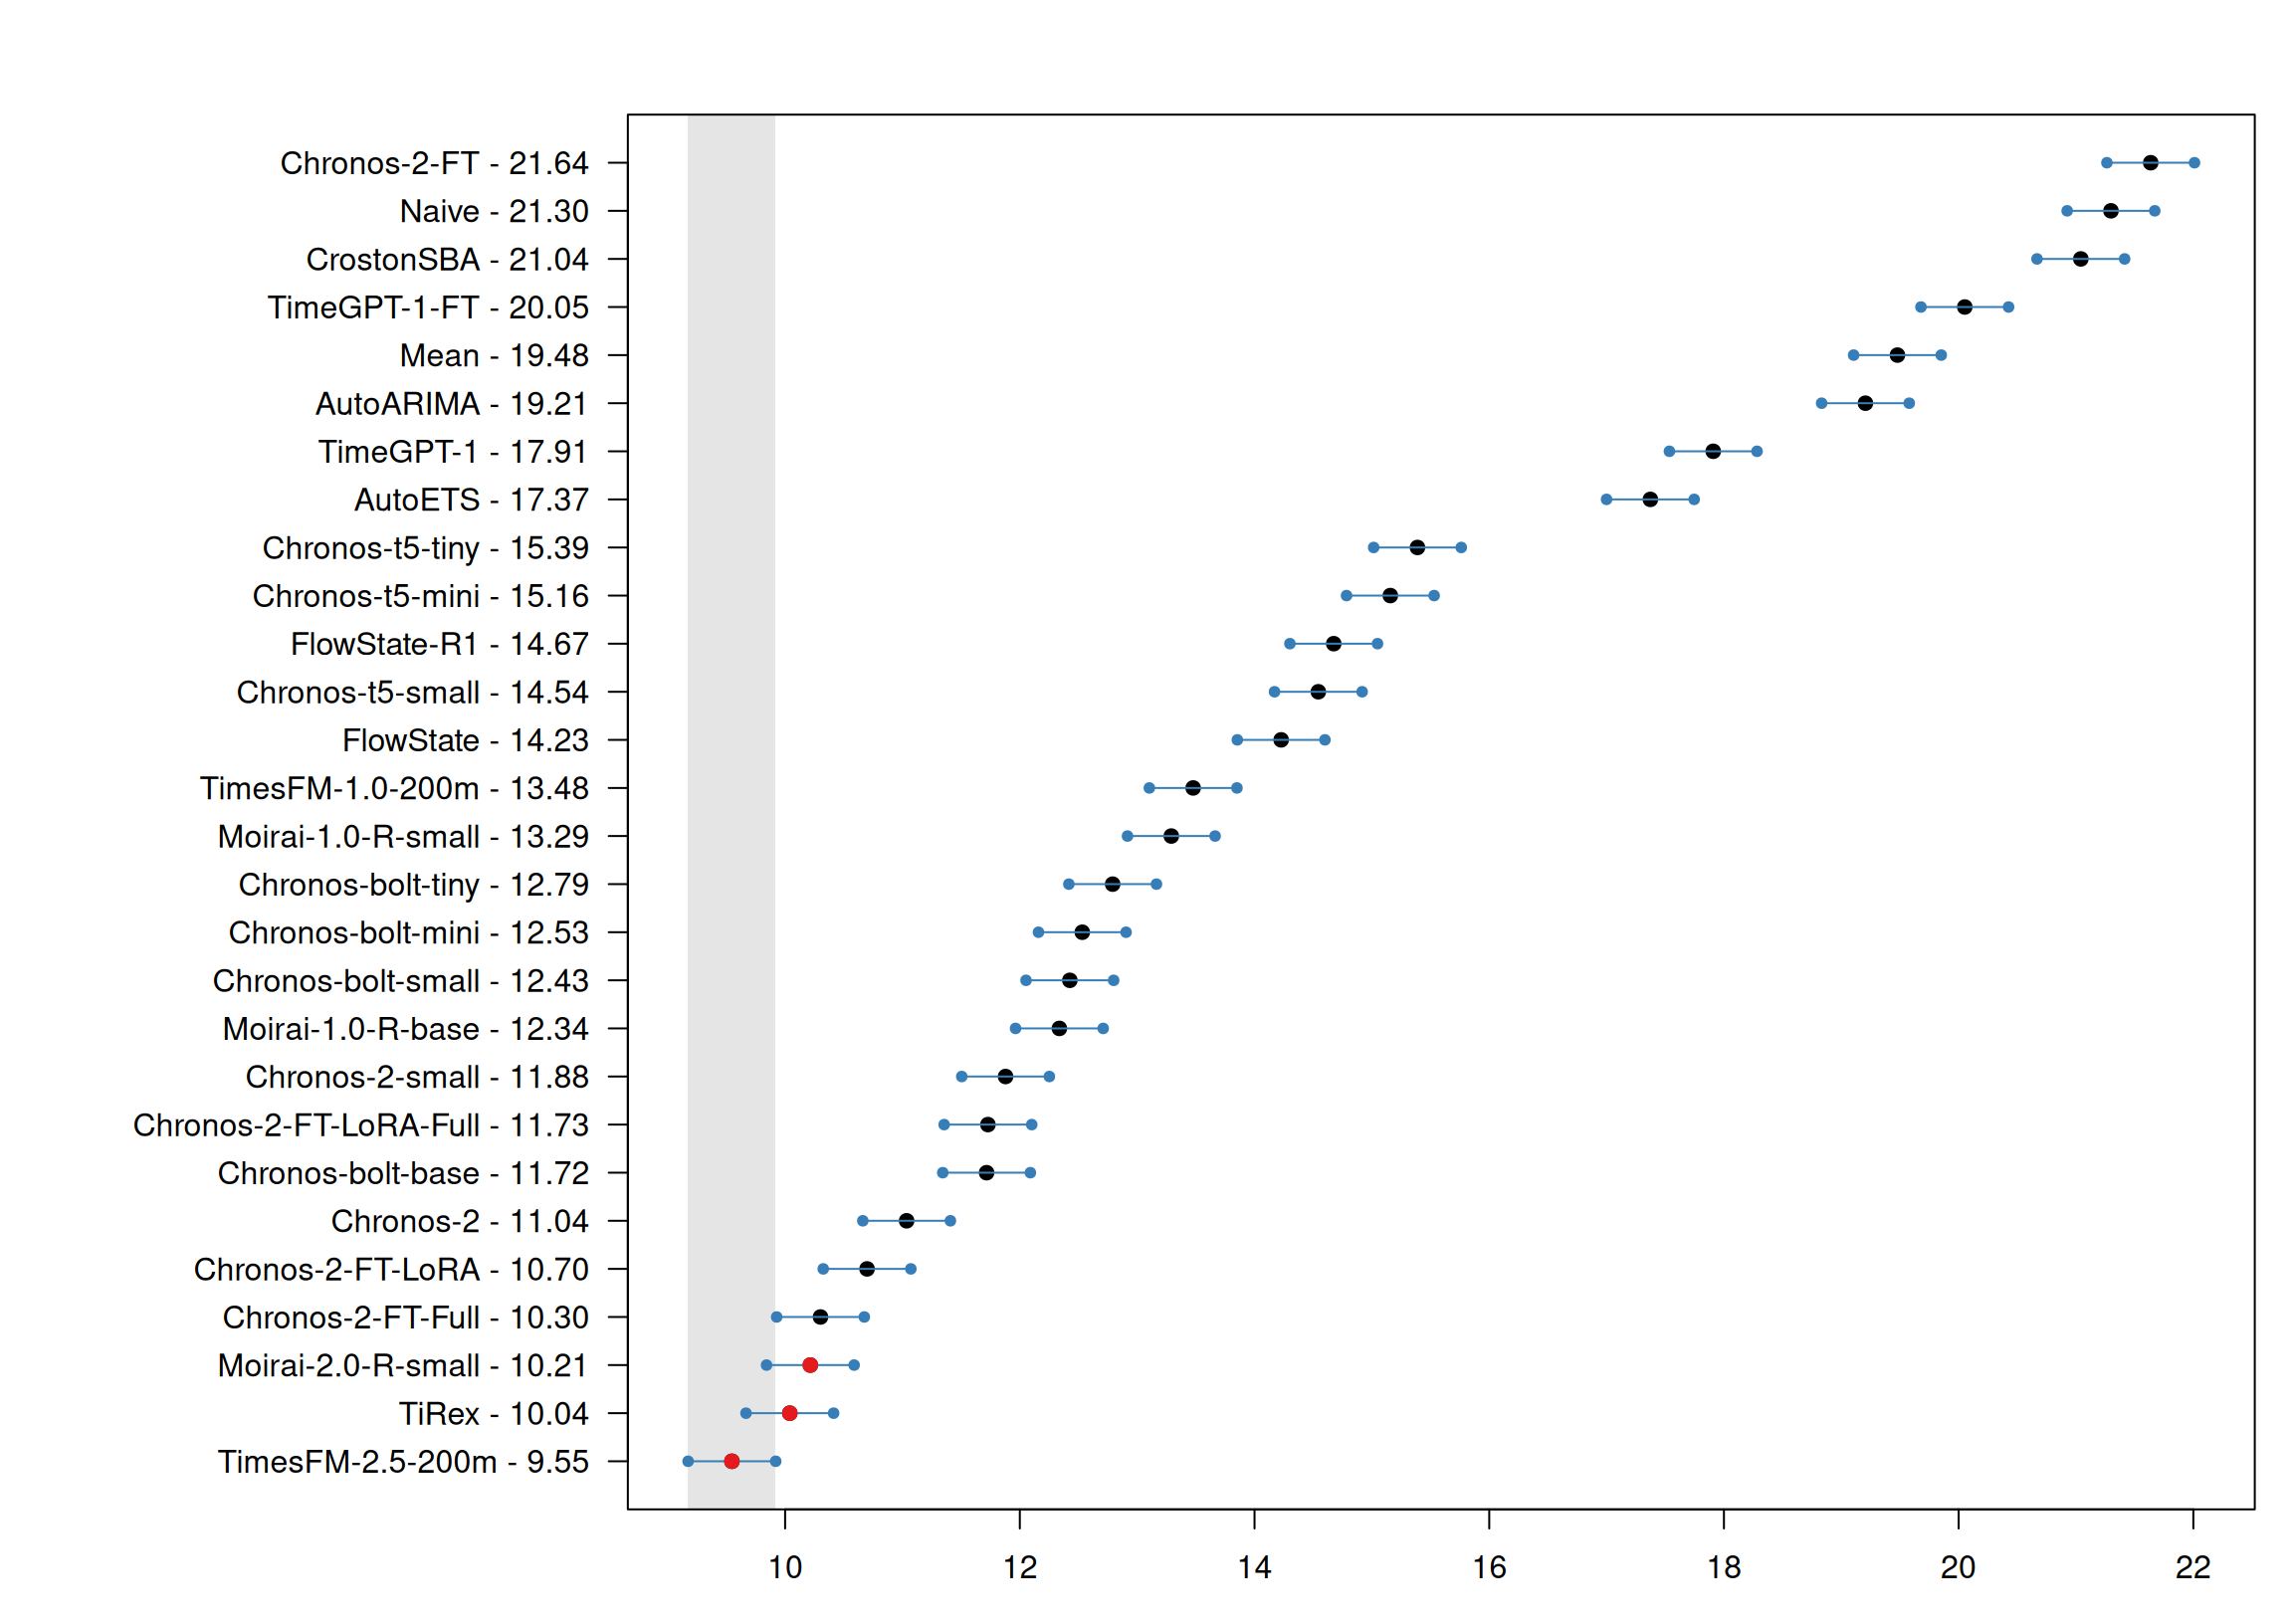
Figure 3: Multiple Comparisons with the Best (MCB) test results for sPIN.
Aggregate loss can hide miscalibration
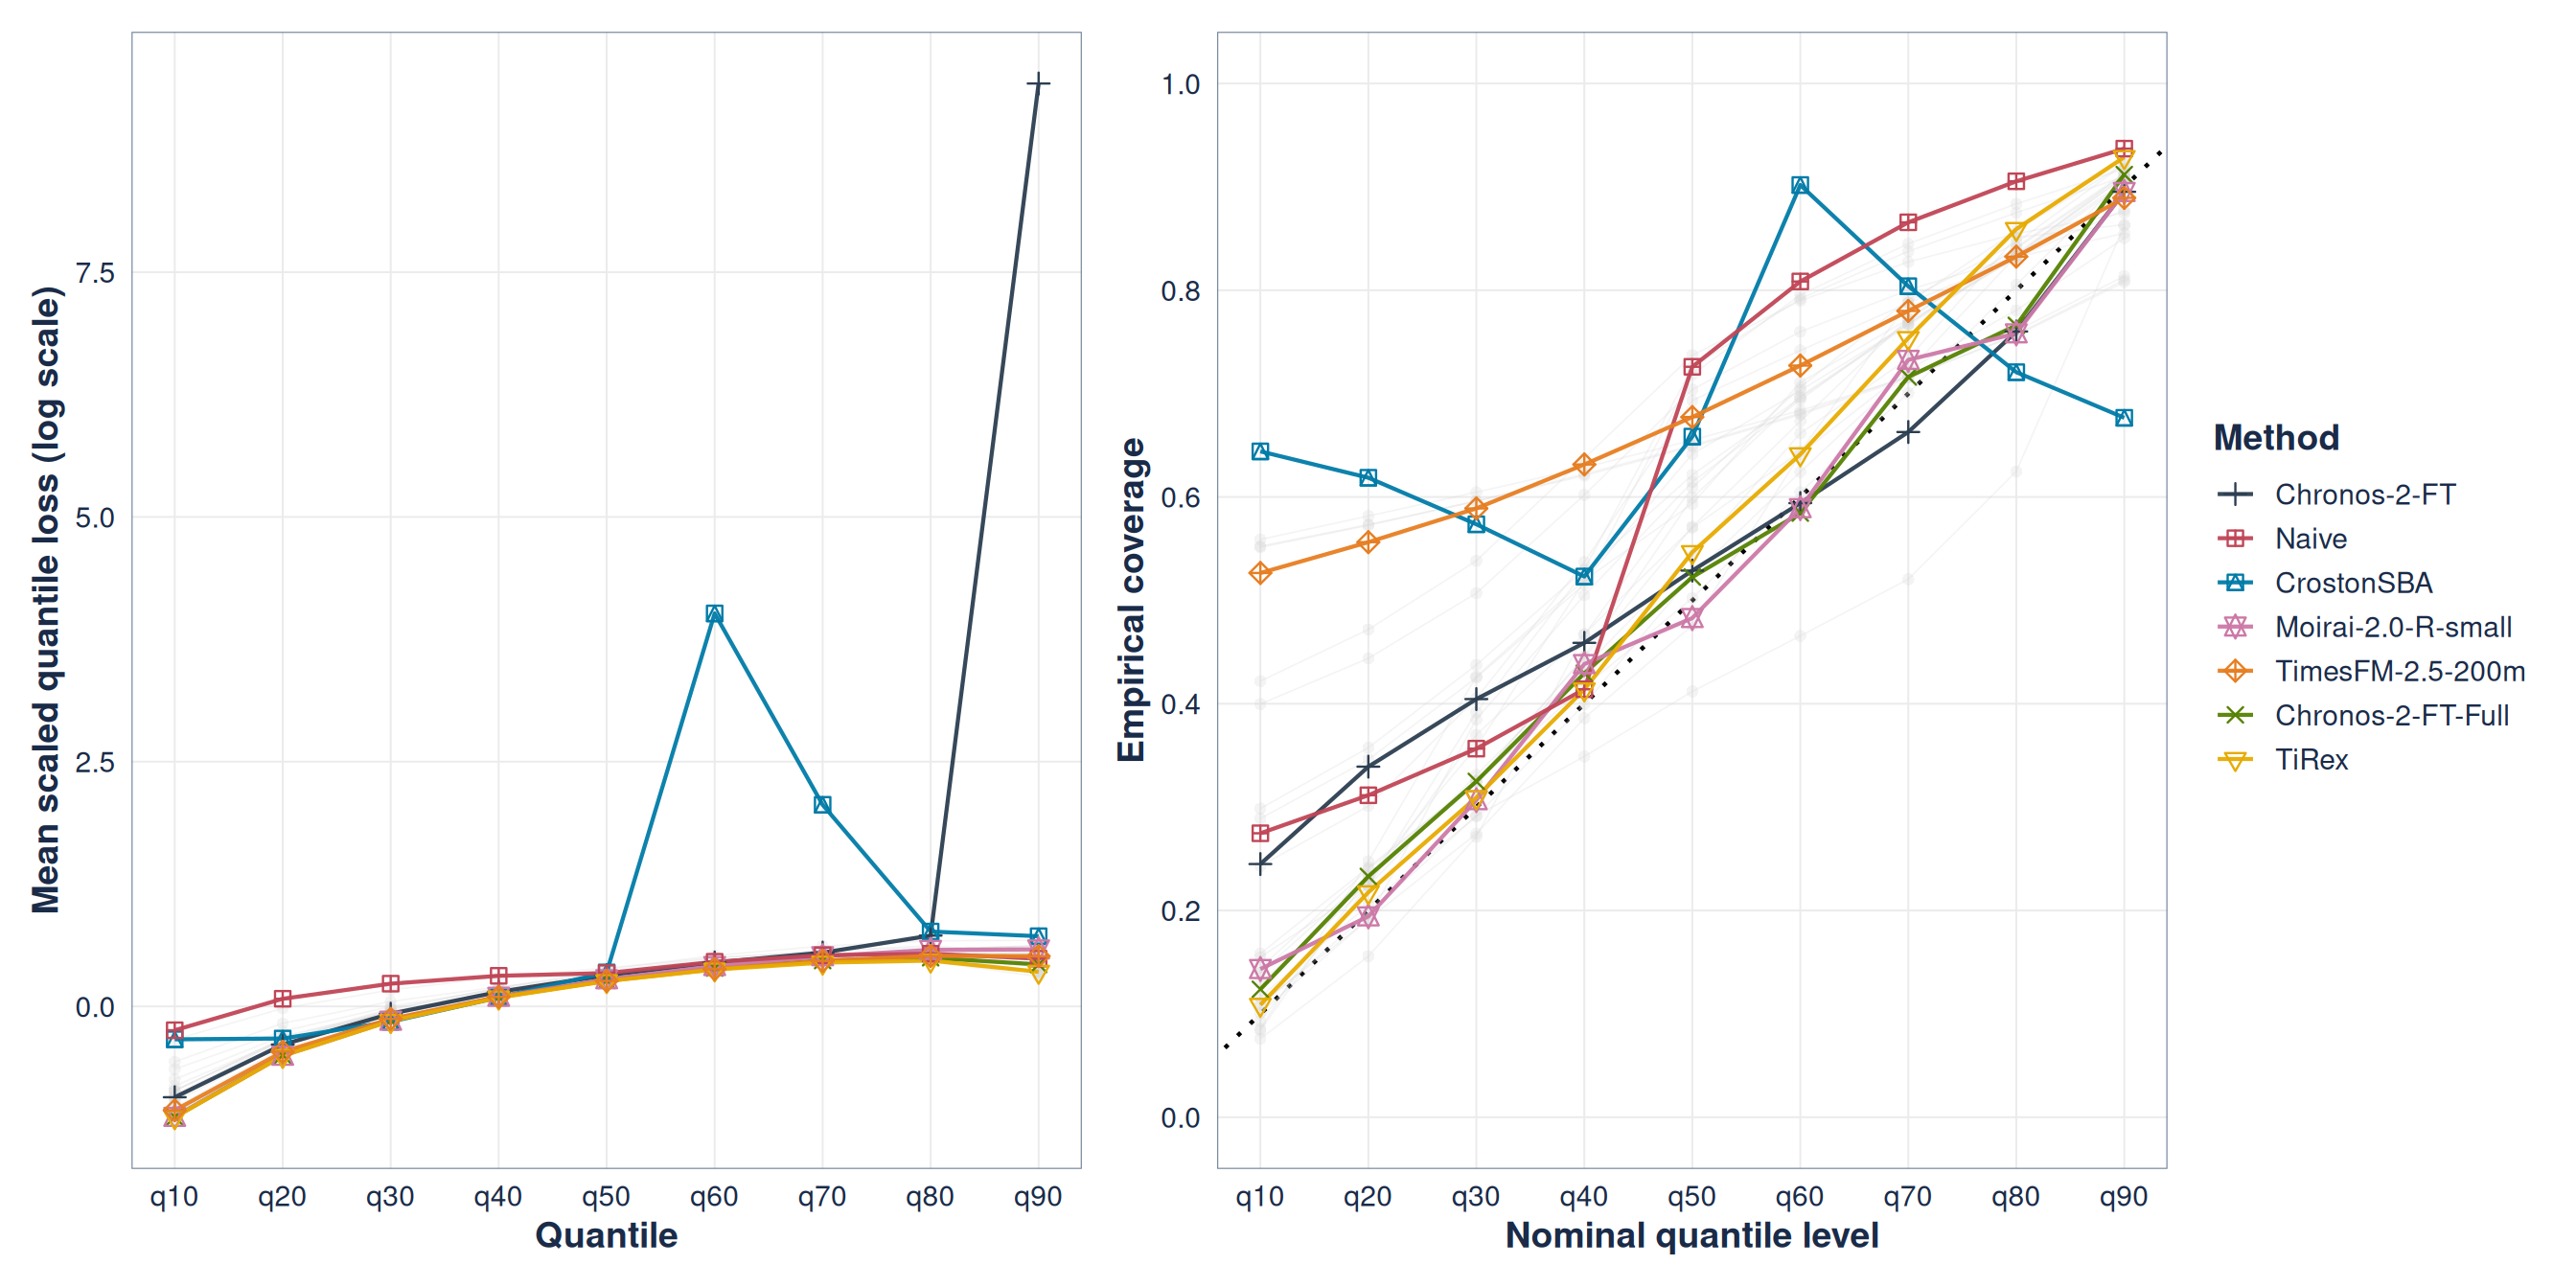
Figure 4: Scaled quantile loss and empirical versus nominal coverage at forecast horizon 3 for the highlighted models.
Aggregate loss can hide miscalibration
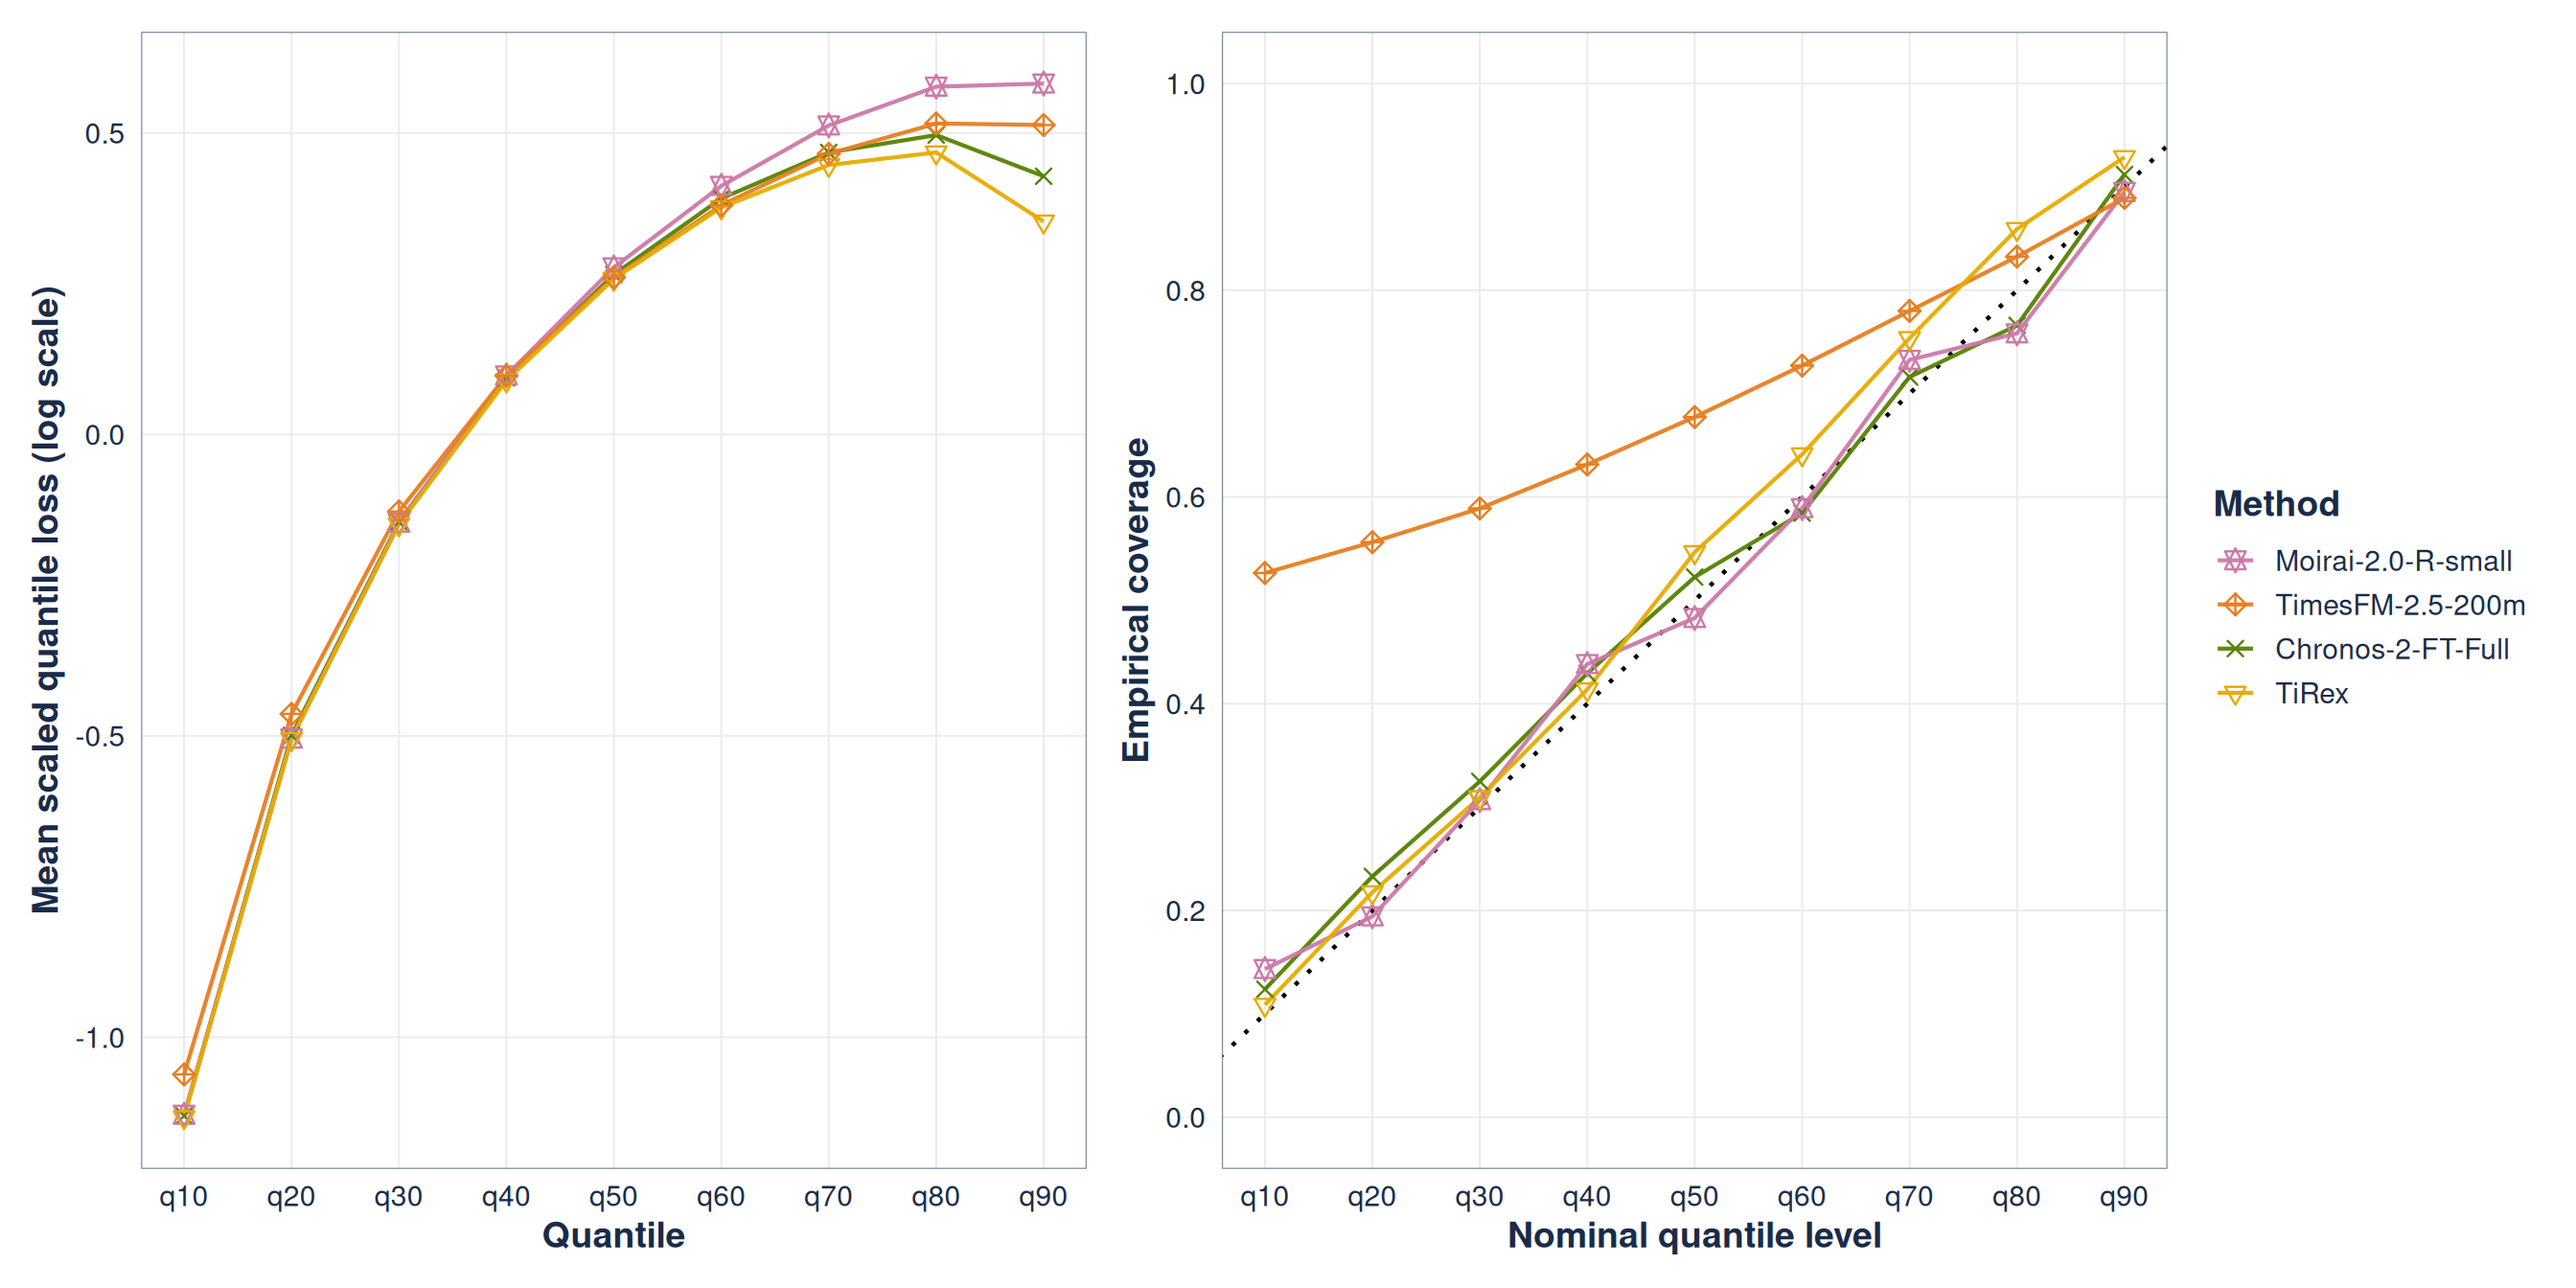
Figure 5: Scaled quantile loss and empirical versus nominal coverage at forecast horizon 3 for the top-ranked models.
Aggregate loss can hide miscalibration
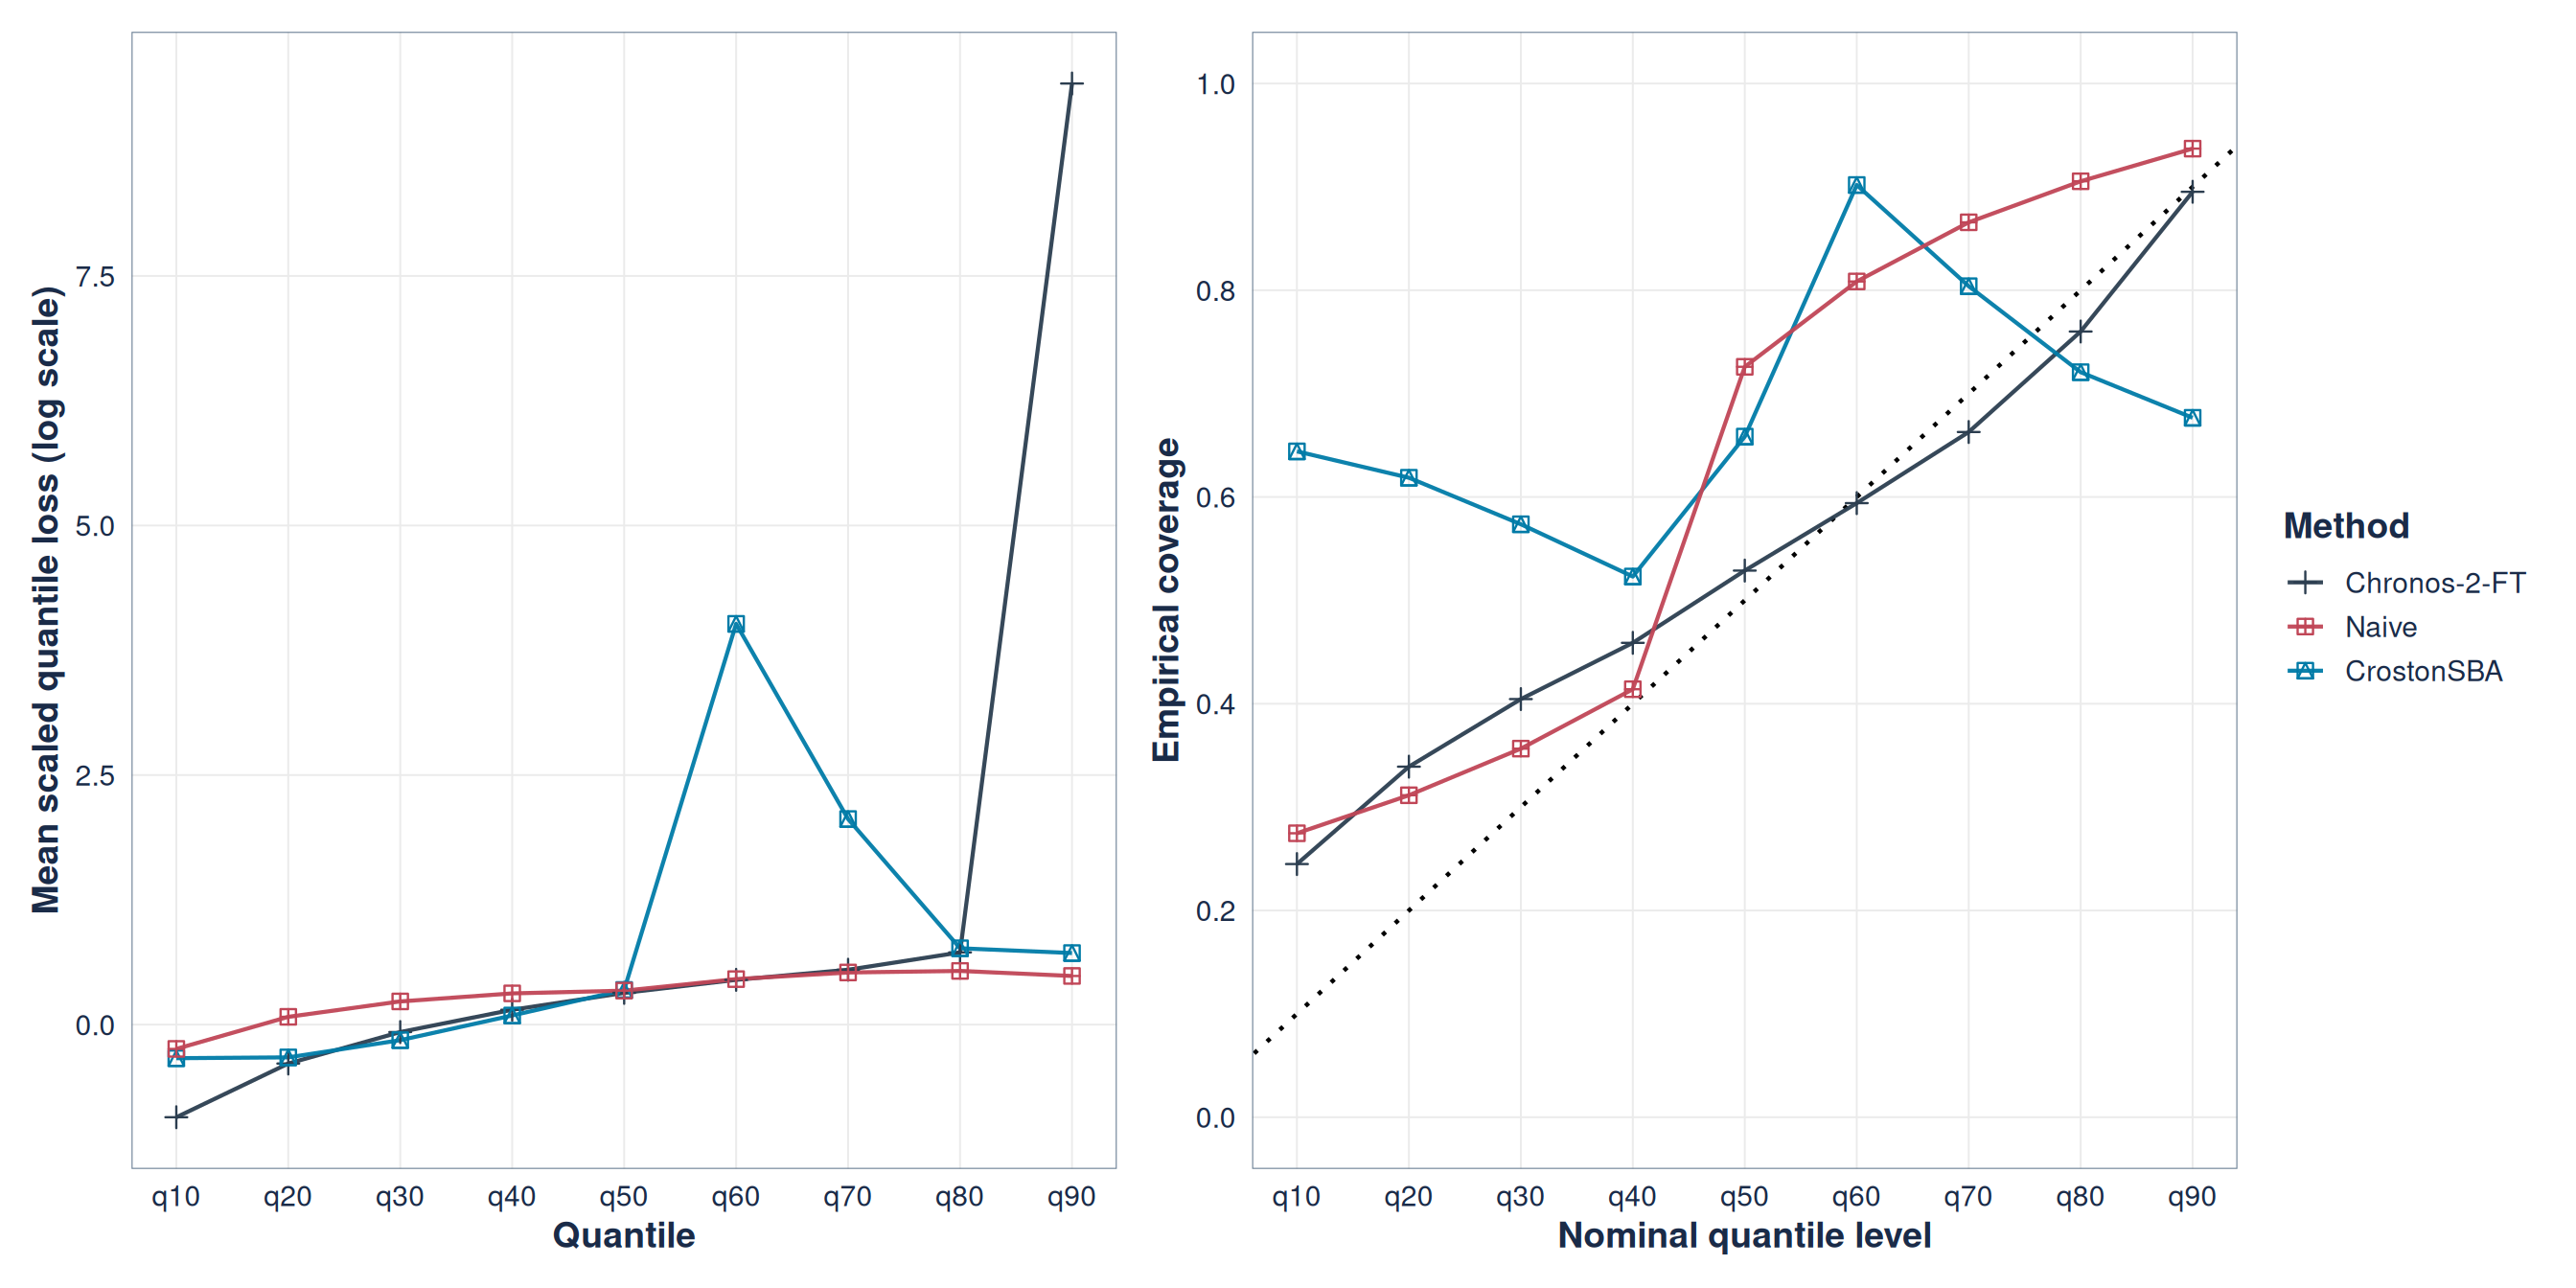
Figure 6: Scaled quantile loss and empirical versus nominal coverage at forecast horizon 3 for the bottom-ranked models.
Useful gains are available within minutes
Figure 7: Models with total cross-validation runtime of up to 10 minutes are highlighted.
The operational shortlist expands within one hour
Figure 8: Models with total cross-validation runtime of up to one hour are highlighted.
Accuracy gains come with computational costs
Figure 9: Average point-forecast rank versus total cross-validation runtime across all evaluated models.

Maintainability and debuggability
- High runtime
Too slow for large rolling evaluations.
e.g.; Chronos-t5-large, TimesFM-2-500m
- Unstable outputs
Negative or extreme forecast values.
e.g.; Chronos-2-synthetic
- Configuration failure
Model paths, dependencies, API issues.
e.g.; LagLlama, Chronos-2-LoRA
- Fine-tuning risk
Local fine tune can worsen performance.
e.g.; TimeGPT, Chronos-2

The operational question is not “TSFM or baseline?”
it is;
Which model gives enough forecast quality to justify its complexity?
- Accuracy show whether it improves forecasts.
- Calibration shows whether uncertainty can be trusted.
- Runtime shows whether it can scale.
- Maintainability and debuggability show whether it can survive deployment.

Where this work goes next
- From forecast accuracy to decision value
Evaluate whether better forecasts improve ordering, allocation, stock availability, and budget use.
- From benchmark results to model-selection guidance
Develop a practical framework for deciding when simple baselines are enough, when TSFMs are justified.
- From cloud inference to data governance
Account for country-level data residency, privacy, and infrastructure constraints.
- From offline evaluation to embedded systems
Test how these methods work inside LMIS, DHIS2, CHAP, or other routine planning workflows.

Experimental design

Country-level model ranking: RMSSE
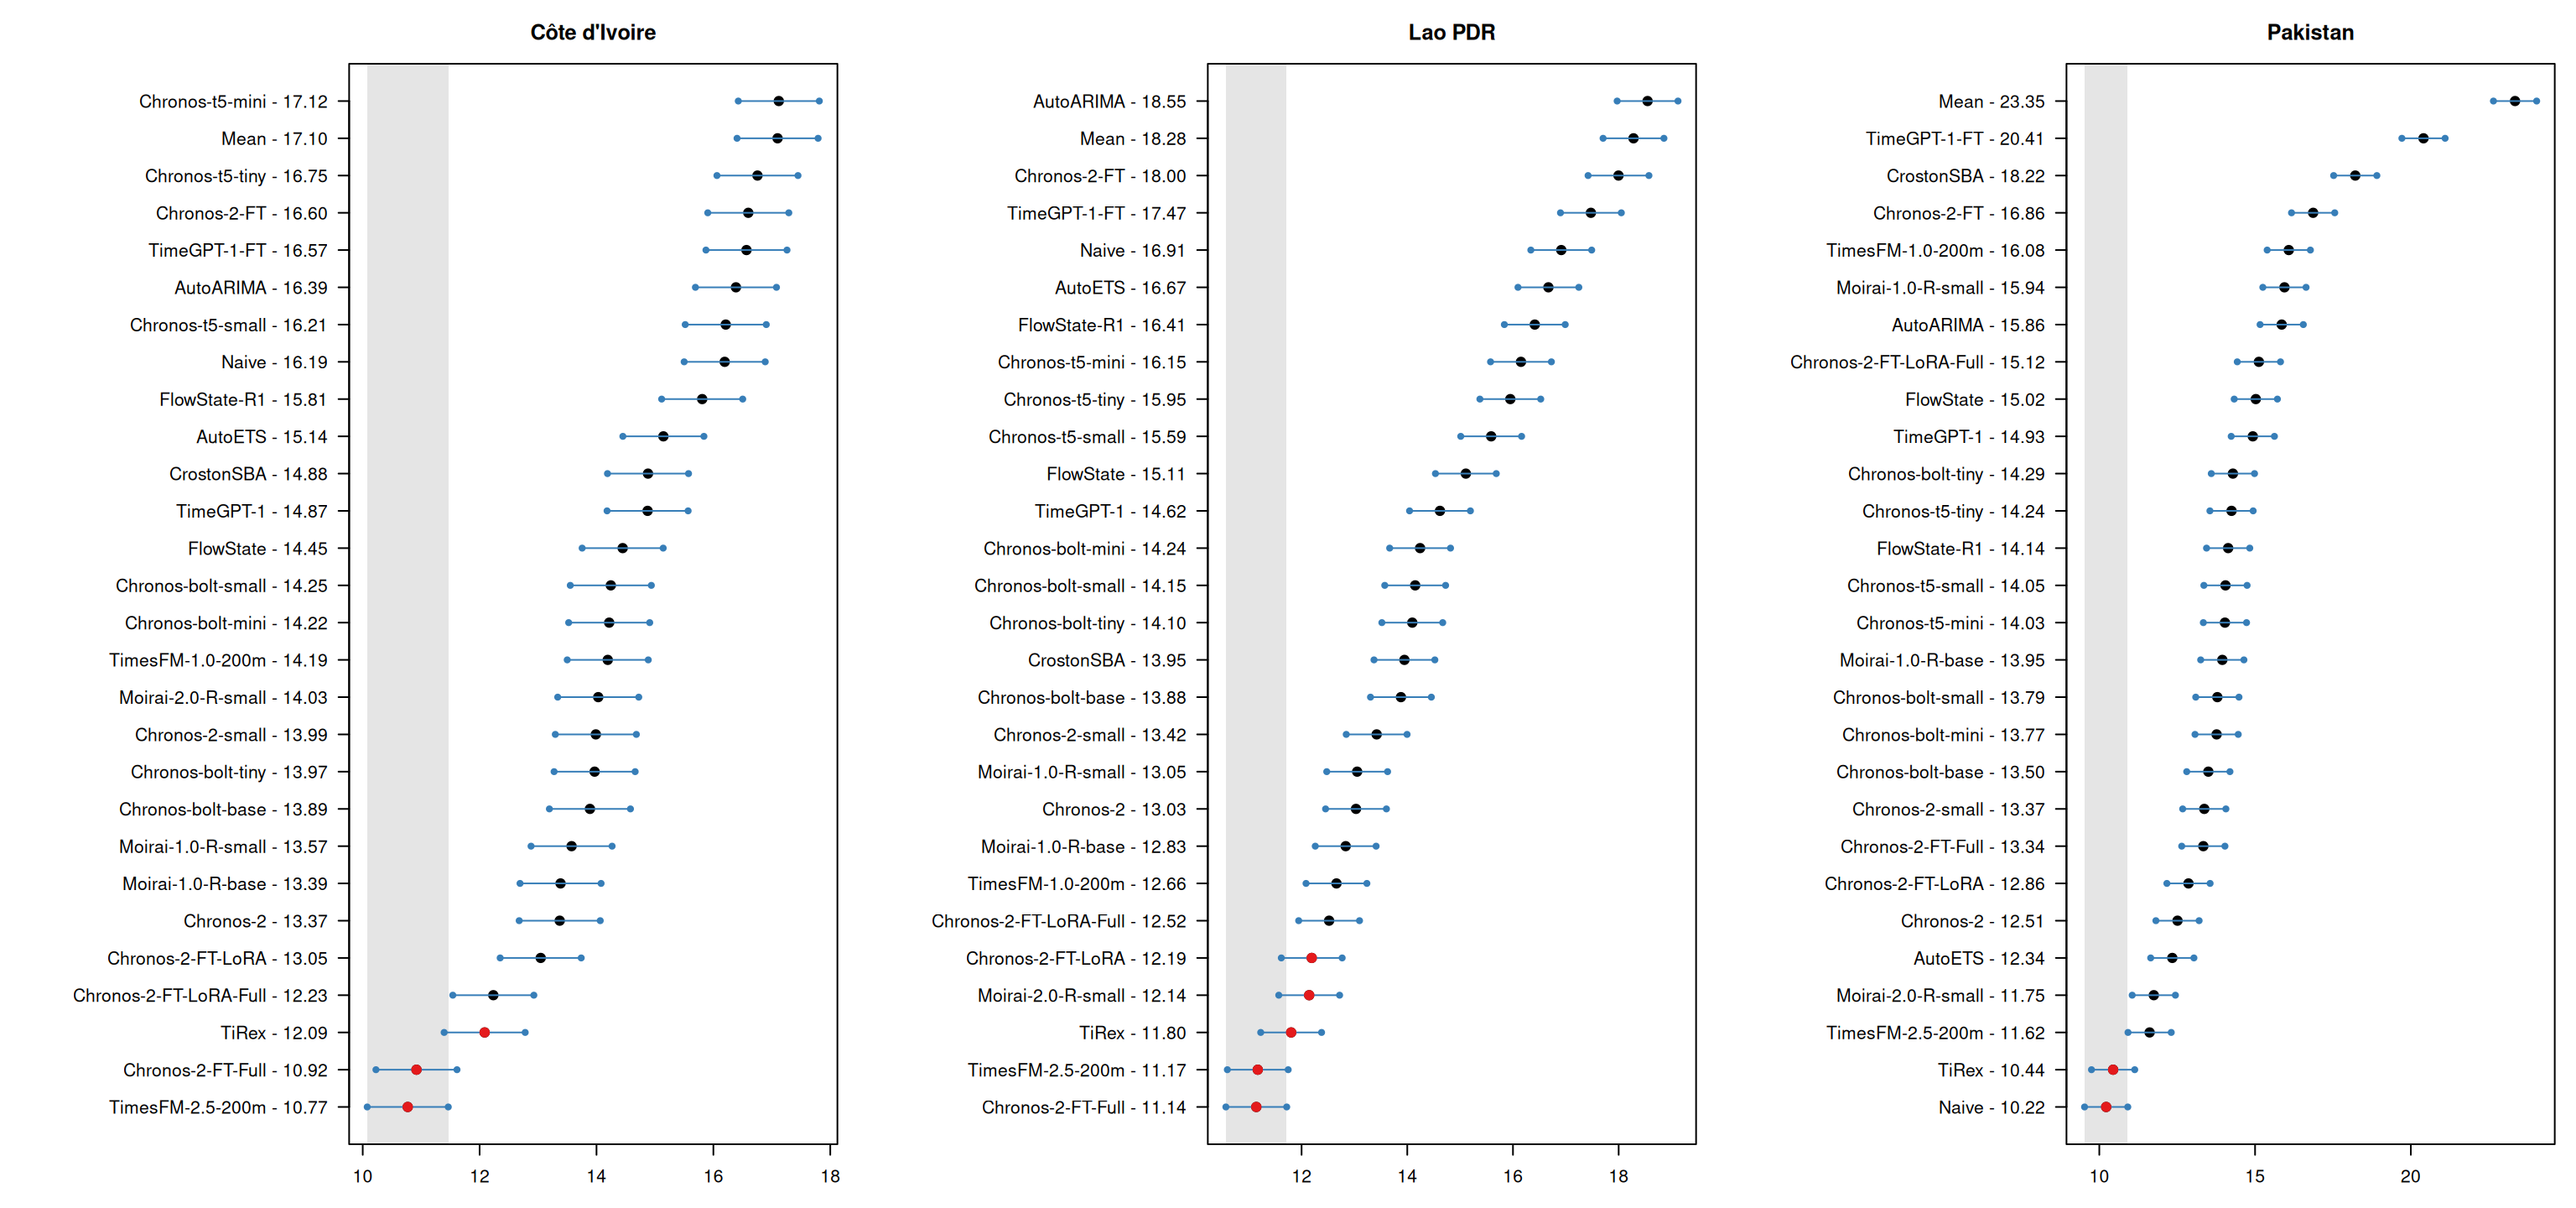
Figure 10: Country-level Multiple Comparisons with the Best (MCB) test results for RMSSE at forecast horizon 3.
Country-level model ranking: sPIN
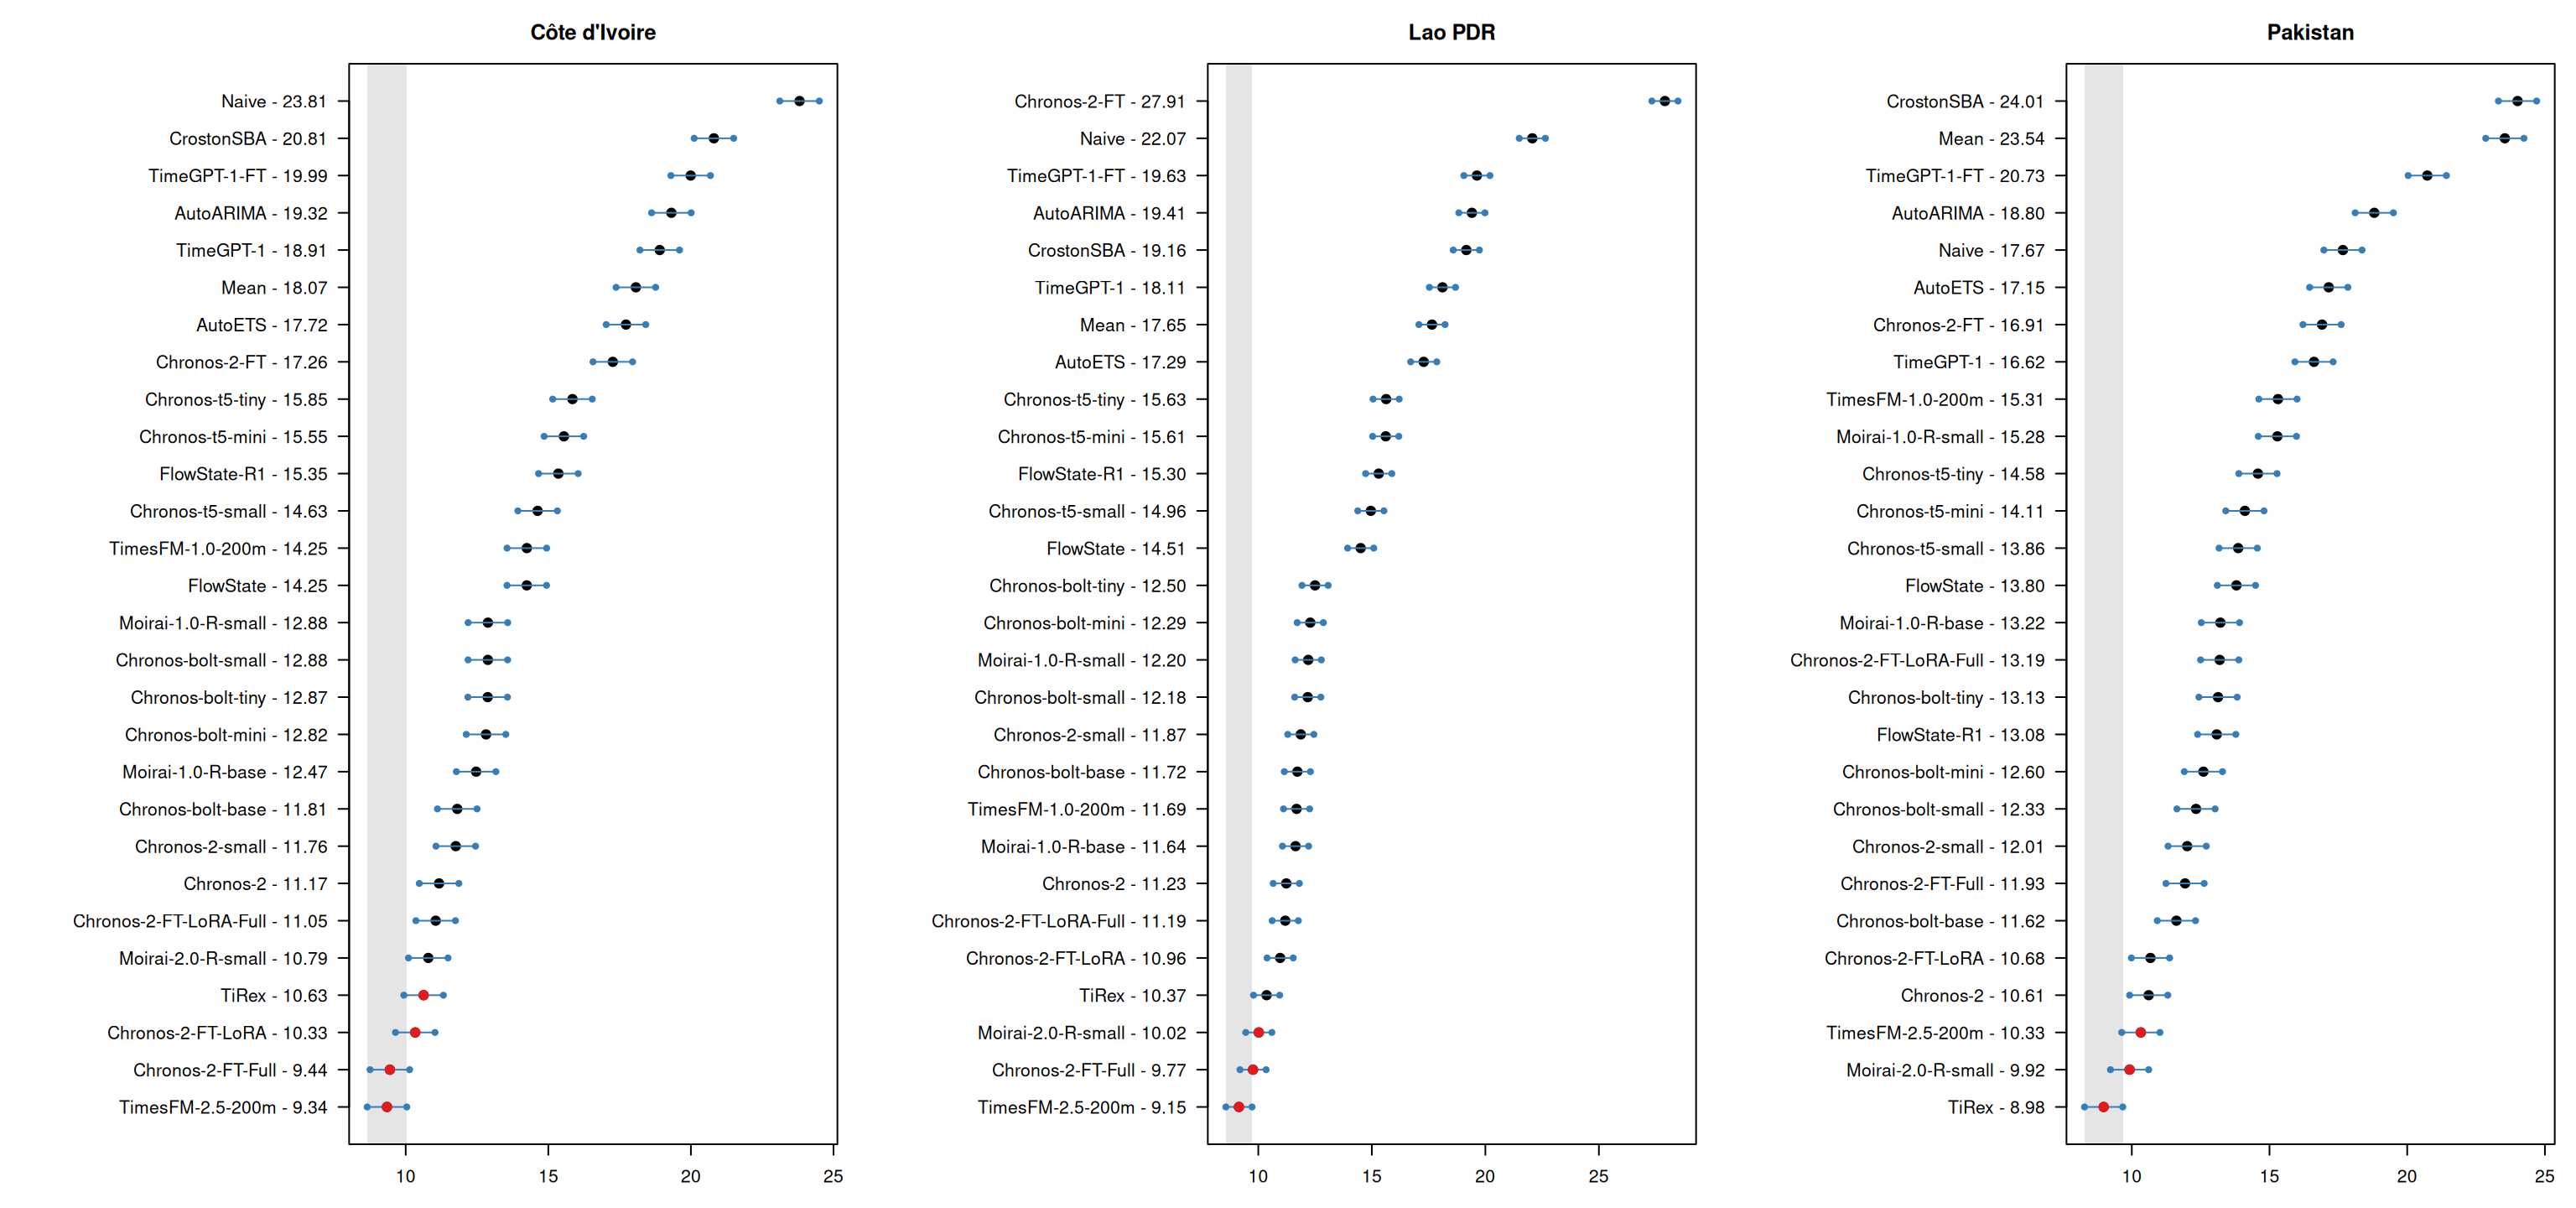
Figure 11: Country-level Multiple Comparisons with the Best (MCB) test results for sPIN at forecast horizon 3.
Accuracy gains come with computational costs
Figure 12: Average probabilistic-forecast rank versus total cross-validation runtime at forecast horizon 3.
Experimental design